. 2018 Apr 27;38(2):BSR20171350.
doi: 10.1042/BSR20171350. Print 2018 Apr 27.

Genome-wide differential expression profiling of mRNAs and lncRNAs associated with prolificacy in Hu sheep

Affiliations

Genome-wide differential expression profiling of mRNAs and lncRNAs associated with prolificacy in Hu sheep

Xu Feng et al. Biosci Rep. .

Abstract

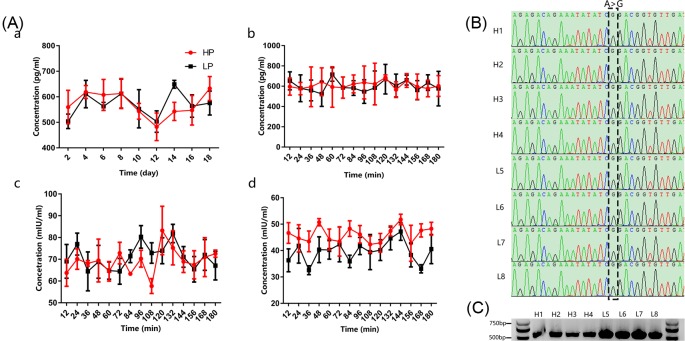
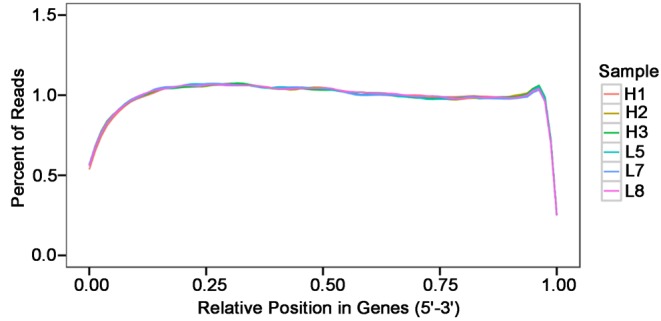
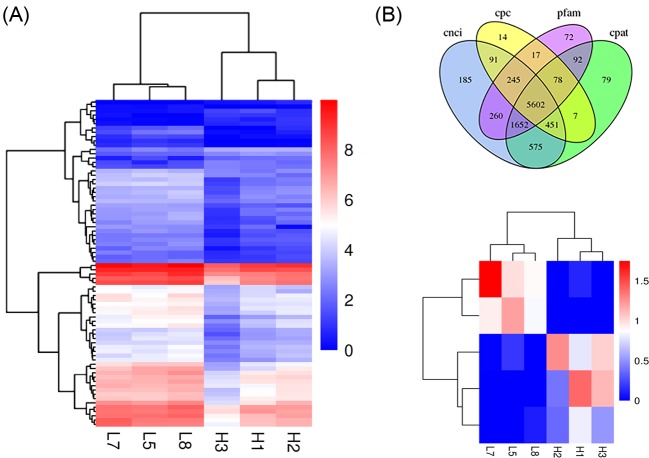
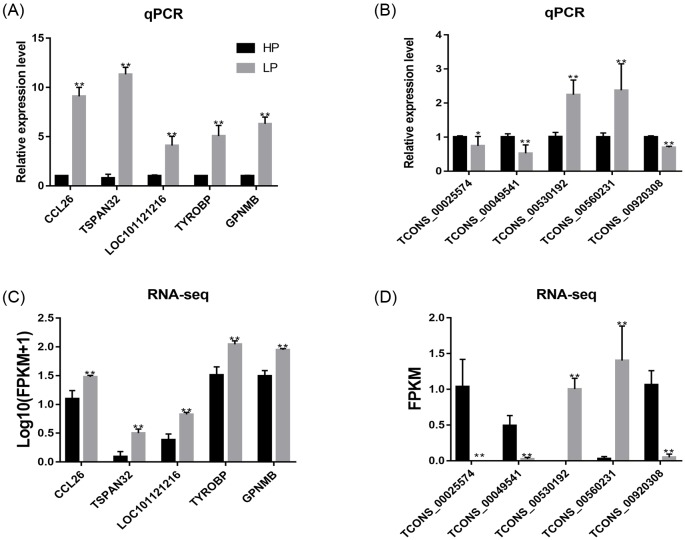
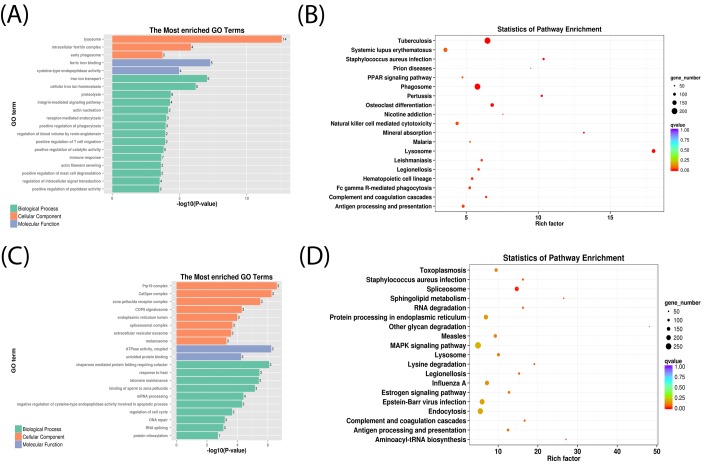
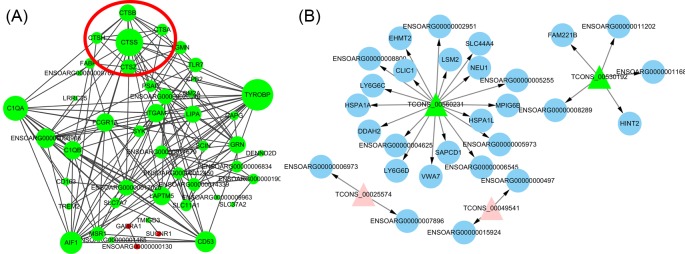
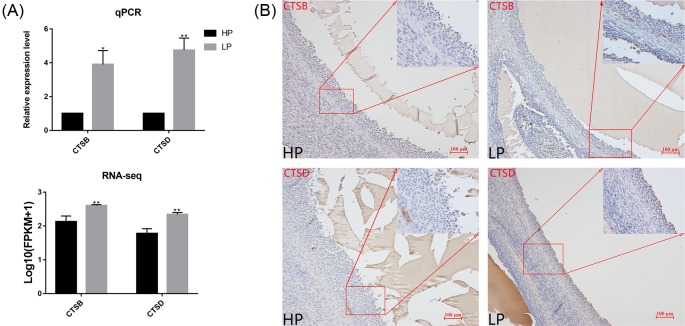
Reproductive ability, especially prolificacy, impacts sheep profitability. Hu sheep, a unique Chinese breed, is recognized for its high prolificacy (HP), early sexual maturity, and year-round estrus. However, little is known about the molecular mechanisms underlying HP in Hu sheep. To explore the potential mRNAs and long non-coding RNAs (lncRNAs) involved in Hu sheep prolificacy, we performed an ovarian genome-wide analysis of mRNAs and lncRNAs during the follicular stage using Hu sheep of HP (litter size = 3; three consecutive lambings) and low prolificacy (LP, litter size = 1; three consecutive lambings). Plasma luteinizing hormone (LH) concentration was higher in the HP group than in the LP group (P<0.05) during the follicular stage. Subsequently, 76 differentially expressed mRNAs (DE-mRNAs) and five differentially expressed lncRNAs (DE-lncRNAs) were identified by pairwise comparison; quantitative real-time PCR (qRT-PCR) analysis of ten randomly selected DE genes (mRNA and lncRNA) were consistent with the sequencing results. Gene Ontology (GO) analysis of DE-mRNAs revealed significant enrichment in immune response components, actin filament severing and phagocytosis. Pathway enrichment analysis of DE-mRNAs indicated a predominance of immune function pathways, including phagosomes, lysosomes, and antigen processing. We constructed a co-expression network of DE-mRNAs and mRNA-lncRNAs, with C1qA, CD53, cathepsin B (CTSB), CTSS, TYROBP, and AIF1 as the hub genes. Finally, the expression of lysosomal protease cathepsin genes, CTSB and cathepsin D (CTSD), were significantly up-regulated in sheep ovaries in the HP group compared with the LP group (P<0.05). These differential mRNAs and lncRNAs may provide information on the molecular mechanisms underlying sheep prolificacy.

Keywords: Hu Sheep; Ovary; Prolificacy; RNA-seq; lncRNA.


Conflict of interest statement

The authors declare that there are no competing interests associated with the manuscript.

Figures

Figure 1
Figure 1. Changes in the concentrations of reproductive hormones and BMPR-1B mutations in HP and LP Hu sheep
(A) The black and red lines represent data for the HP and LP Hu sheep, respectively. (a) Changes in the E2 concentration during the estrous cycle; (b) changes in the E2 concentration during intensive blood collection; (c) changes in the FSH concentration during intensive blood collection; (d) changes in the LH concentration during intensive blood collection. (B) Sequencing results for eight ewes. In eight ewes, the CAG site in exon 6 of BMPR-1B amplification products were CGG. (C) Representative PCR for the BMPR-1B gene performed on samples of every ewe.
Figure 2
Figure 2. The positional distribution of mapped reads on mRNA
The abscissa is the normalized mRNA position and the ordinate is the percentage of reads in the total range of the corresponding mapped reads. As the length of the reference mRNA differs, each mRNA is divided into 100 intervals by length, and the number and percentage of mapped reads in each interval are counted. The figure summarizes the proportion of mapped reads.
Figure 3
Figure 3. DE-mRNA and lncRNA
(A) Hierarchical cluster showing relative expression levels of 76 mRNAs between two groups; (B) non-coding transcripts identified by the four predictors were analyzed statistically, and then a Venn diagram of all predicted results was obtained. The lncRNA was predicted by four methods and 5602 lncRNA were found. The hierarchical clusters show the relative expression of five lncRNAs between two groups.
Figure 4
Figure 4. Validation of RNA-seq results using qRT-PCR and RNA-seq, respectively
(A,B) The relative expression of DE-mRNA and DE-lncRNA was determined by q-PCR. Comparisons by independent-sample t test, using SPSS 24.0. *: P<0.05; **: P<0.01. (C) RNA-seq data of DE-mRNA; relative expression level, normalized by log10 (FPKM + 1). (D) RNA-seq data of DE-lncRNA; relative expression level, normalized by FPKM. Abbreviations: CCL26, C–C motif chemokine ligand 26; GPNMB, glycoprotein nmb; LOC101121216, serum amyloid A protein-like; TSPAN32, tetraspanin 32; TYROBP, TYRO protein tyrosine kinase binding protein.
Figure 5
Figure 5. Top GO and KEGG pathway enrichment analyses of DE-mRNAs and target genes of DE-lncRNAs
(A) Top 20 GO terms of DE-mRNAs. (B) Top 20 pathways of DE-mRNAs. (C) Top 20 GO terms of the target genes of DE-lncRNAs. (D) Top 20 pathways of the target genes of DE-lncRNAs.
Figure 6
Figure 6. Network between DE-mRNAs and DE-lncRNAs
(A) Using STRING, the network of mRNA was constructed with 48 DE-mRNAs, and a significant interaction between these genes was found. Green nodes represent up-regulated genes, pink nodes represent down-regulated genes. The size of the node represents the number of genes that interact with it, the larger the node, the more genes that interact with it. Amongst the red circles is a member of the cathepsins family such as CTSB. (B) Four DE-lncRNAs were used to construct a network between lncRNA and mRNA. The nodes of the triangle represent lncRNA, and the circular nodes represent mRNA. Green nodes represent up-regulated genes, pink nodes represent down-regulated genes.
Figure 7
Figure 7. The pattern of CTSB and CTSD expression in the ovaries
(A) The relative expression level of CTSB and CTSD as determined by qRT-PCR, and the RNA-seq data of CTSB/CTSD relative expression, normalized by log10 (FPKM + 1). Comparisons were made using independent-sample t test, with SPSS 24.0. *: P<0.05; **: P<0.01. CTSB and CTSD primers are shown in Supplementary Table S1. (B) Representative immumohistochemical staining for CTSB and CTSD in the ovaries of HP and LP ewes. CTSB and CTSD proteins were both positively expressed in granulosa cells.

References

    1. Bodin L., Di Pasquale E., Fabre S., Bontoux M., Monget P., Persani L. et al. (2007) A novel mutation in the bone morphogenetic protein 15 gene causing defective protein secretion is associated with both increased ovulation rate and sterility in Lacaune sheep. Endocrinology 148, 393–400 10.1210/en.2006-0764 - DOI - PubMed
    1. Henry D.G. (2005) Major genes affecting ovulation rate in sheep. Genet. Select. Evol. 37 (Suppl. 11), S11 10.1186/1297-9686-37-S1-S11 - DOI - PMC - PubMed
    1. Wang W., Liu S., Li F.Y., Pan X., Li C., Zhang X. et al. (2015) Polymorphisms of the ovine BMPR-IB, BMP-15 and FSHR and their associations with litter size in two Chinese indigenous sheep breeds. Int. J. Mol. Sci. 16, 11385–11397 10.3390/ijms160511385 - DOI - PMC - PubMed
    1. Paz E., Quinones J., Bravo S., Montaldo H.H. and Sepulveda N. (2015) Genotyping of BMPR1B, BMP15 and GDF9 genes in Chilean sheep breeds and association with prolificacy. Anim. Genet. 46, 98–99 10.1111/age.12254 - DOI - PubMed
    1. Chu M.X., Sang L., Wang J.Y., Fang L. and Ye S.C. (2005) Study on BMP15 and GDF9 as candidate genes for prolificacy of Small Tail Han sheep. Acta Genet. Sin. 32, 38–45 - PubMed

Publication types