. 2018 Jun;70(6):841-854.
doi: 10.1002/art.40453. Epub 2018 May 3.

Transcriptional Profiling of Synovial Macrophages Using Minimally Invasive Ultrasound-Guided Synovial Biopsies in Rheumatoid Arthritis

Affiliations

Transcriptional Profiling of Synovial Macrophages Using Minimally Invasive Ultrasound-Guided Synovial Biopsies in Rheumatoid Arthritis

Arthur M Mandelin 2nd et al. Arthritis Rheumatol. 2018 Jun.

Abstract

Objective: Currently, there are no reliable biomarkers for predicting therapeutic response in patients with rheumatoid arthritis (RA). The synovium may unlock critical information for determining efficacy, since a reduction in the numbers of sublining synovial macrophages remains the most reproducible biomarker. Thus, a clinically actionable method for the collection of synovial tissue, which can be analyzed using high-throughput strategies, must become a reality. This study was undertaken to assess the feasibility of utilizing synovial biopsies as a precision medicine-based approach for patients with RA.

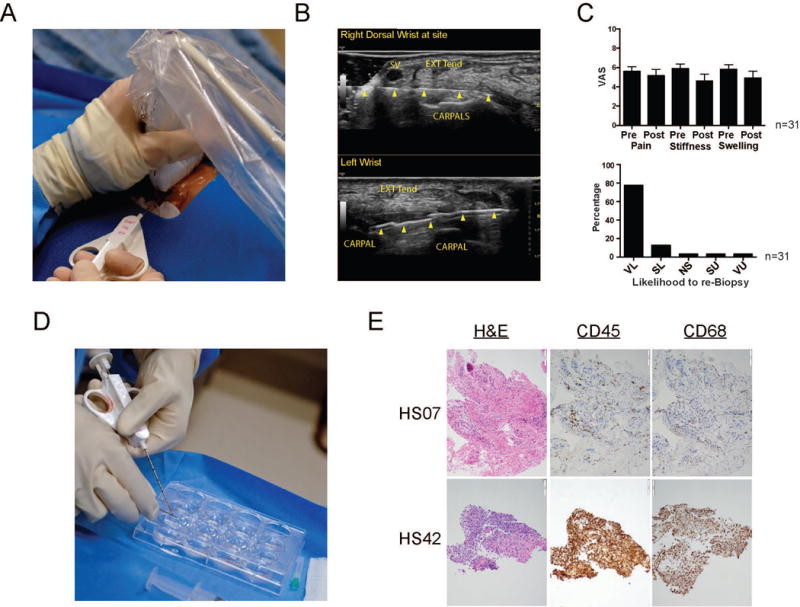
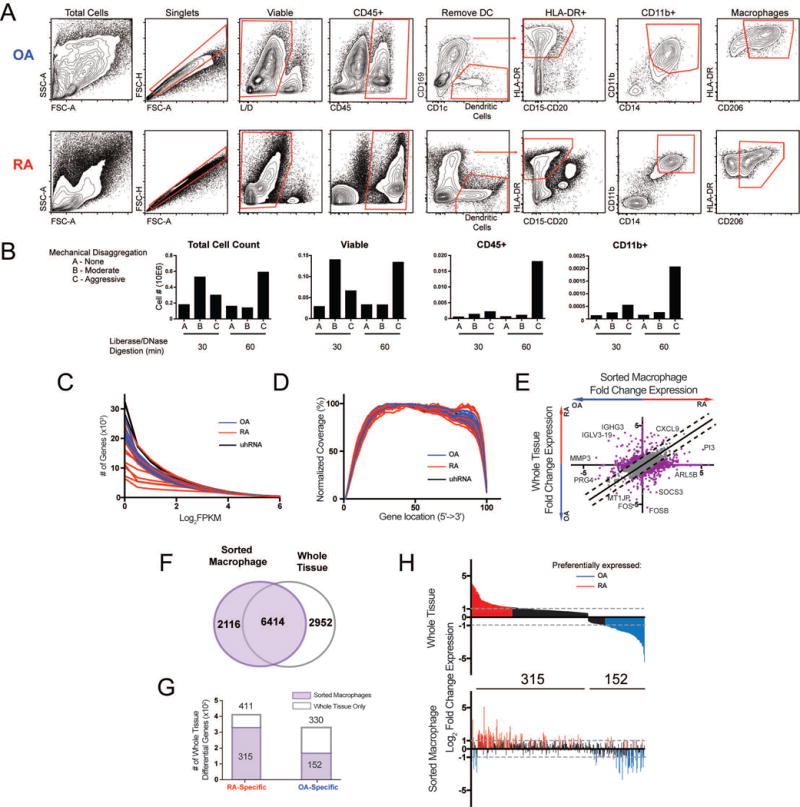
Methods: Rheumatologists at 6 US academic sites were trained in minimally invasive ultrasound-guided synovial tissue biopsy. Biopsy specimens obtained from patients with RA and synovial tissue from patients with osteoarthritis (OA) were subjected to histologic analysis, fluorescence-activated cell sorting, and RNA sequencing (RNA-seq). An optimized protocol for digesting synovial tissue was developed to generate high-quality RNA-seq libraries from isolated macrophage populations. Associations were determined between macrophage transcriptional profiles and clinical parameters in RA patients.

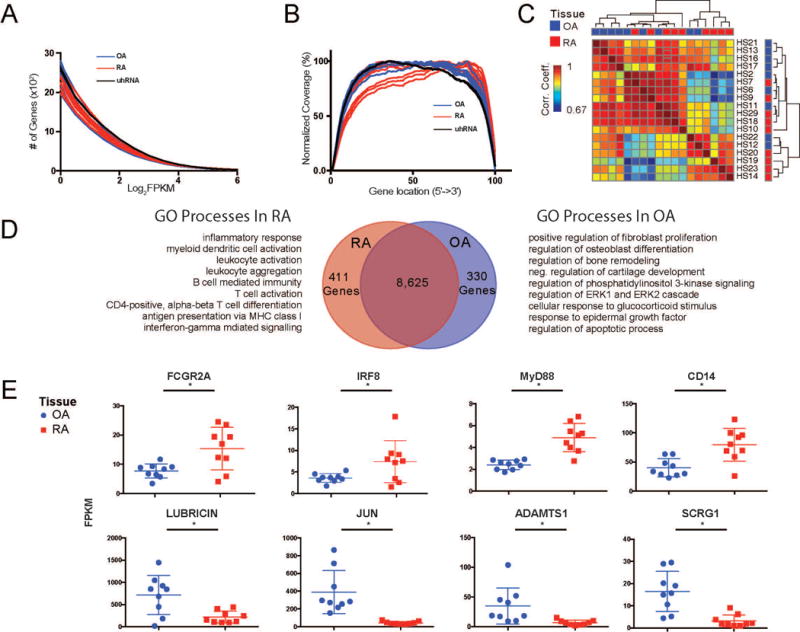
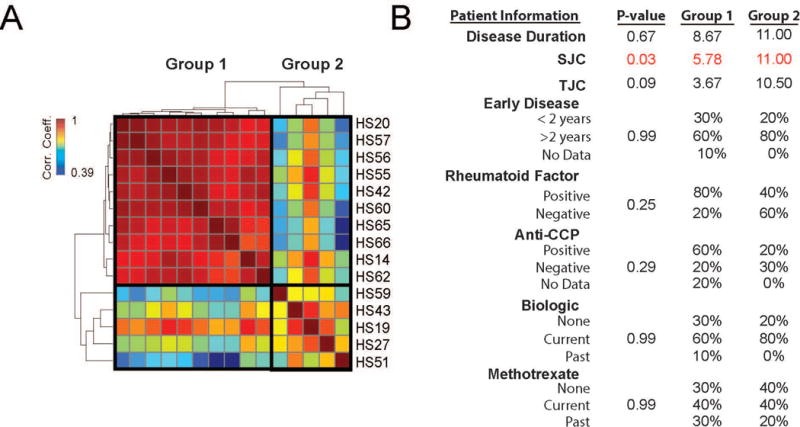
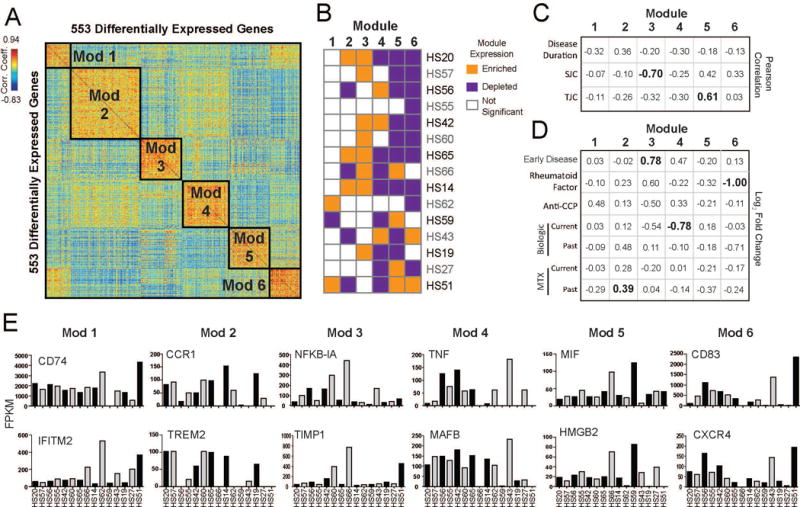
Results: Patients with RA reported minimal adverse effects in response to synovial biopsy. Comparable RNA quality was observed from synovial tissue and isolated macrophages between patients with RA and patients with OA. Whole tissue samples from patients with RA demonstrated a high degree of transcriptional heterogeneity. In contrast, the transcriptional profile of isolated RA synovial macrophages highlighted different subpopulations of patients and identified 6 novel transcriptional modules that were associated with disease activity and therapy.

Conclusion: Performance of synovial tissue biopsies by rheumatologists in the US is feasible and generates high-quality samples for research. Through the use of cutting-edge technologies to analyze synovial biopsy specimens in conjunction with corresponding clinical information, a precision medicine-based approach for patients with RA is attainable.


Conflict of interest statement

Disclosures

The authors declare no competing financial interests.

Figures

Figure 1
Figure 1
Acquisition of synovial tissue from patients with RA. A. Ultrasound guided synovial biopsy from inflamed wrist with an 18-gauge by 1.5-inch needle. B. Dorsal transverse (axial) view of a right wrist (top) with a 25-gauge by 1.5-inch needle (arrowheads) and left wrist with an 18-gauge by 9 cm needle biopsy device with a 10-mm throw opened (2nd and 3rd arrows from left). SV = superficial vein, EXT TEN = extensor tendon complex, CARPALS = proximal row of carpal bones. C. Patients were asked prior to and following the procedure to complete a visual analogue score (VAS) assessing their pain, stiffness and swelling on a scale of 1-10. Post procedure patients were also asked their likelihood to agree to a subsequent procedure: (VL) very likely, (SL) somewhat likely, (NS) not sure, (SU) somewhat unlikely, and (VU) very unlikely. Error bars display SEM. D. Synovial tissue is removed from biopsy device and placed into PBS on ice until processed. E. Histomorphological features of synovial biopsy obtained from two representative RA patients. Representative photomicrographs of sections stained with Hematoxylin and Eosin (H&E), anti-CD45 (hematopoietic cells), and anti-CD68 antibodies (macrophages).
Figure 2
Figure 2
Analysis of whole tissue RNA-seq libraries. A. The number of genes greater than a given expression level (x-axis - Log2FPKM [Fragments Per Kilobase of transcript per Million reads]) are displayed for each sample. [uhRNA = universal human RNA control] B. Gene coverage plot displays the average read density across genes from 5′ to 3′. C. Pairwise Pearson correlations of gene expression between individual patient samples. Samples are organized by hierarchical clustering based on their Pearson coefficients across samples. The tissue type is indicated by red (RA) and blue (OA) squares on the top and right of the matrix. The patient number for each sample is indicated to the right of the matrix. D. Venn diagram of the genes expressed in RA and OA samples. The differential analysis (adj. p-value <0.01) revealed 411 and 330 genes that were preferentially expressed in RA (red) and OA (blue), respectively. Select processes from GO enrichment analysis on genes preferentially expressed in each tissue type are listed. E. Whisker plots indicating normalized gene expression of individual genes between RA (red) and OA (blue) samples. * indicates differential expression (adj. p-value<0.01).
Figure 3
Figure 3
Isolation of synovial macrophages and macrophage-specific RNA-seq. A. Gating strategy used to identify synovial macrophages in both RA and OA tissue. B. Optimization of the synovial tissue processing procedure. The success of the tissue processing was evaluated by the number of viable, CD45+, and CD11b+ cells identified by flow cytometry. C. Number of genes with expression greater than a given FPKM value for each sample. D. Gene coverage plot displays the average read density across genes from 5′ to 3′. E. Log2 fold change (Log2FC) of gene expression between RA and OA from whole tissue (y-axis) and macrophages (x-axis). Lines indicate differences >1. Select genes are displayed. F. Venn diagram comparing genes from sorted macrophages (purple) and whole tissue (grey outline). G. Bar graph of 741 differential genes from whole tissue (Figure 2D) that are also detected in sorted macrophages (purple). H. The Log2FC in expression of 467 differential genes from G detected in macrophages in whole tissue (top) and sorted macrophages (bottom). In both plots, genes are ordered along the x-axis by decreasing fold-change in whole tissue. Genes preferentially expressed in RA tissue (Log2FC>1) and OA tissue (Log2FC<−1) are colored in red and blue, respectively.
Figure 4
Figure 4
Analysis of global gene expression profiles in sorted macrophages from RA. A. Pairwise Pearson correlation of gene expression between individual patient samples. Samples are organized by hierarchical clustering based on their Pearson coefficients across samples forming 2 groups. B. Table of association analysis between patients in Group 1 and Group 2 as defined in A and clinical parameters. Values reflect either the group average (continuous variables) or percent of patients (categorical variables) in each group with given criteria. P-values for disease duration, SJC and TJC were determined by Student’s t-test and for early disease duration, rheumatoid factor, anti-CCP antibody and treatment status were determined by Fisher’s exact test. Significant values are shown in red. TJC=tender joint count; SJC=swollen joint count; CCP=cyclic citrullinated peptide
Figure 5
Figure 5
A. Pairwise Pearson correlations between 553 differentially expressed genes of their expression across sorted macrophages from RA patients. Genes are clustered using k-means to identify modules of co-regulated genes (Modules 1-6). B. Kolmogorov-Smirnov test to determine if expression of module genes is enriched (orange) or depleted (purple) in each patient (p-value<0.05). C. Table of association displaying the Pearson correlation between the median expression of gene modules in patients and the given clinical parameters (continuous variables) were calculated. Correlation coefficients with a p-value <0.05 are shown in bold. D. Table of association displaying the average fold-change (Log2FC) between median expression of gene modules in patients that were positive vs. negative for the given clinical parameters (categorical variables). Current medication treatment compares patients who were currently on the medication against those who were not on the medication at the time of biopsy. Past medication treatment compares patients who had stopped medication against those who were never on a given medication. Significant comparisons (p-value<0.05, t-test) are shown in bold. MTX=methotrexate. E. Bar graph showing the expression levels (FPKM) across patients with RA of individual genes selected across the 6 Modules.

References

    1. O’Dell JR, Curtis JR, Mikuls TR, Cofield SS, Bridges SL, Jr, Ranganath VK, et al. Validation of the methotrexate-first strategy in patients with early, poor-prognosis rheumatoid arthritis: results from a two-year randomized, double-blind trial. Arthritis Rheum. 2013;65(8):1985–94. - PMC - PubMed
    1. Saevarsdottir S, Wallin H, Seddighzadeh M, Ernestam S, Geborek P, Petersson IF, et al. Predictors of response to methotrexate in early DMARD naive rheumatoid arthritis: results from the initial open-label phase of the SWEFOT trial. Ann Rheum Dis. 2011;70(3):469–75. - PubMed
    1. Bathon JM, Martin RW, Fleischmann RM, Tesser JR, Schiff MH, Keystone EC, et al. A comparison of etanercept and methotrexate in patients with early rheumatoid arthritis. N Engl J Med. 2000;343(22):1586–93. - PubMed
    1. Breedveld FC, Weisman MH, Kavanaugh AF, Cohen SB, Pavelka K, van Vollenhoven R, et al. The PREMIER study: A multicenter, randomized, double-blind clinical trial of combination therapy with adalimumab plus methotrexate versus methotrexate alone or adalimumab alone in patients with early, aggressive rheumatoid arthritis who had not had previous methotrexate treatment. Arthritis Rheum. 2006;54(1):26–37. - PubMed
    1. Emery P, Breedveld FC, Hall S, Durez P, Chang DJ, Robertson D, et al. Comparison of methotrexate monotherapy with a combination of methotrexate and etanercept in active, early, moderate to severe rheumatoid arthritis (COMET): a randomised, double-blind, parallel treatment trial. Lancet. 2008;372(9636):375–82. - PubMed

Publication types