

Snacking Patterns in Children: A Comparison between Australia, China, Mexico, and the US
- PMID: 29439472
- PMCID: PMC5852774
- DOI: 10.3390/nu10020198
Snacking Patterns in Children: A Comparison between Australia, China, Mexico, and the US
Abstract
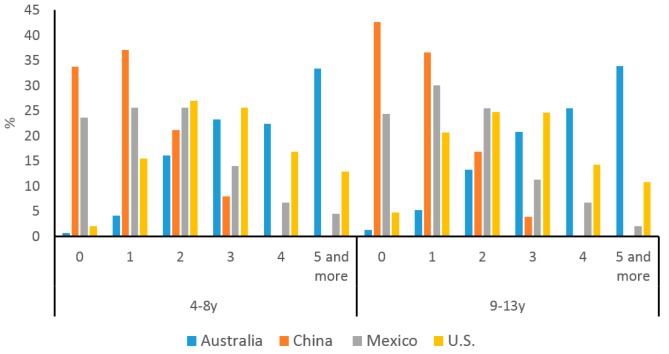
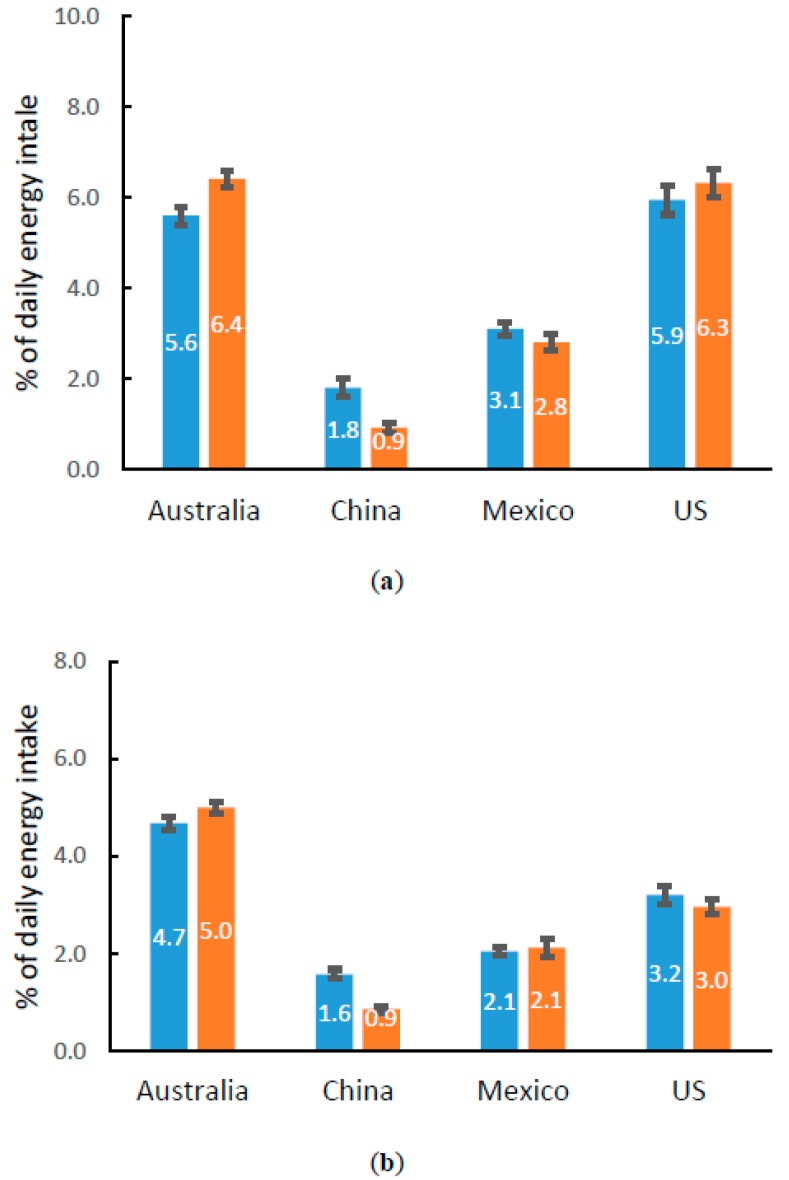
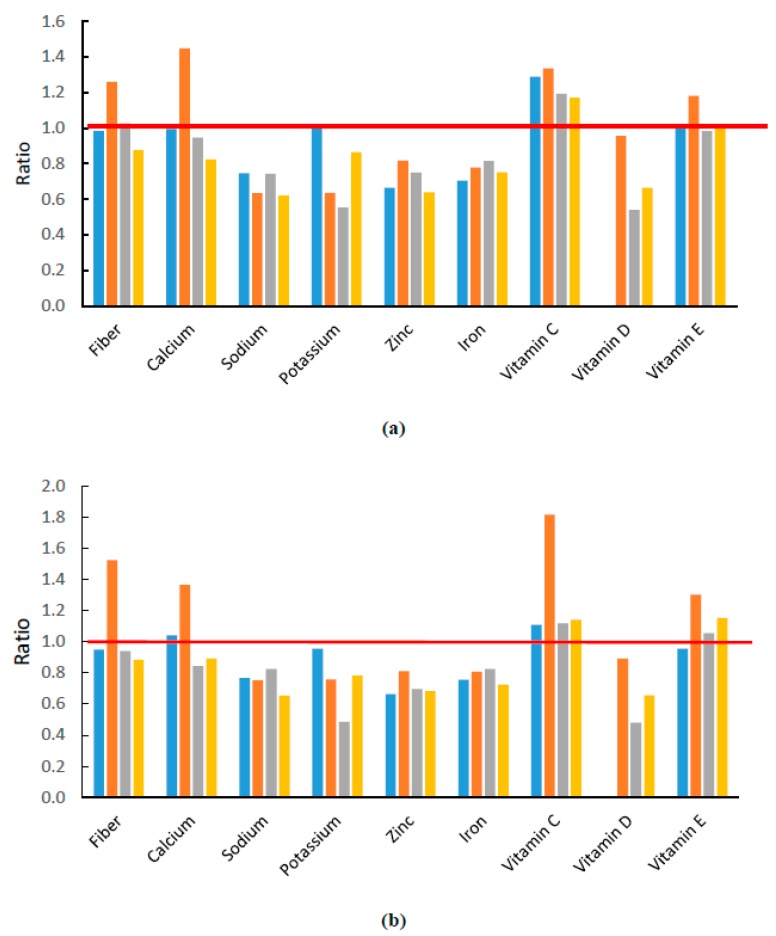
Snacking is common in children and influenced by many factors. The aim of this study is to provide insight of both common and country-specific characteristics of snacking among 4-13 year old children. We analyzed snacking prevalence, energy and nutrient contributions from snacking across diverse cultures and regions, represented by Australia, China, Mexico, and the US using data from respective national surveys. We found that the highest prevalence of snacking was in Australia and the US (over 95%) where snacking provided one-third and one-quarter of total energy intake (TEI), respectively, followed by Mexico (76%, provided 15% TEI) and China (65%, provided 10% TEI). Compared to 4-8 year-olds, the consumption of fruits and milk was lower in 9-13 year-old children, with a trend of increasing savory snacks consumption in China, Mexico, and the US. The nutrient density index of added sugars and saturated fat was higher, especially in Australia, Mexico, and the US. Results suggested that snacking could be an occasion to promote fruit and vegetable consumption in all countries, especially for older children. Snacking guidelines should focus on reducing consumption of snacks high in saturated fat and added sugars for Australia, Mexico, and the US, whereas improving dairy consumption is important in China.
Keywords: children; energy; nutrients; patterns; snacking.
Conflict of interest statement
The authors declare no conflict of interest. All authors are Nestlé employees.
Figures
References
-
- US Department of Agriculture, Agriculture Research Service Percentages of Selected Nutrients Contributed by Food and Beverages Consumed at Snack Occasions, by Gender and Age, What We Eat in America, NHANES 2013–2014. [(accessed on 23 October 2017)]; Available online: https://www.ars.usda.gov/ARSUserFiles/80400530/pdf/1314/Table_25_SNK_GEN....
-
- Fayet-Moore F., Peters V., McConnell A., Petocz P., Eldridge A.L. Weekday snacking prevalence, frequency, and energy contribution have increased while foods consumed during snacking have shifted among Australian children and adolescents: 1995, 2007 and 2011–12 national nutrition surveys. Nutr. J. 2017;16:65. doi: 10.1186/s12937-017-0288-8. - DOI - PMC - PubMed
Publication types
MeSH terms
LinkOut - more resources
Full Text Sources
Other Literature Sources
