Review
. 2018 Feb 12;11(2):287.
doi: 10.3390/ma11020287.

Chemical Sensing Applications of ZnO Nanomaterials

Affiliations
Review

Chemical Sensing Applications of ZnO Nanomaterials

Savita Chaudhary et al. Materials (Basel). .

Abstract

Recent advancement in nanoscience and nanotechnology has witnessed numerous triumphs of zinc oxide (ZnO) nanomaterials due to their various exotic and multifunctional properties and wide applications. As a remarkable and functional material, ZnO has attracted extensive scientific and technological attention, as it combines different properties such as high specific surface area, biocompatibility, electrochemical activities, chemical and photochemical stability, high-electron communicating features, non-toxicity, ease of syntheses, and so on. Because of its various interesting properties, ZnO nanomaterials have been used for various applications ranging from electronics to optoelectronics, sensing to biomedical and environmental applications. Further, due to the high electrochemical activities and electron communication features, ZnO nanomaterials are considered as excellent candidates for electrochemical sensors. The present review meticulously introduces the current advancements of ZnO nanomaterial-based chemical sensors. Various operational factors such as the effect of size, morphologies, compositions and their respective working mechanisms along with the selectivity, sensitivity, detection limit, stability, etc., are discussed in this article.

Keywords: chemical sensing; morphology; selectivity; sensitivity; synthesis; zinc oxide.


Conflict of interest statement

The authors declare no conflict of interest.

Figures

Figure 1
Figure 1
(a) Electrochemical measurement of fabricated phenyl hydrazine chemical sensor by using ZnO nano-urchins. (b,c) current-voltage (I–V) response in the presence and absence of phenyl hydrazine by employing the modified GCE in 10 mL, 0.1 M phosphate-buffered saline (PBS) solution. (d) Schematic mechanism of sensing. Adapted figure from [35] with permission from copyright, (2015), Elsevier.
Figure 2
Figure 2
(a) Typical cyclic voltammetry (CV) sweep curve for Ag-ZnO nanoellipsoids/Au modified electrode with and without 11.0 mmol·L−1 hydrazine in 0.1 mol·L−1 phosphate buffer solution (PBS; pH ~ 7) at scan rate of 100 mV/s; (b) CV sweep curves at different scan rates (50, 60, 70, 80, 90, 100, 200, 300, 400, 500, 600, 700, and 800 mV/s) of Ag-ZnO nanoellipsoids/Au modified electrode. Adapted figure from [37] with permission from copyright (2015), Elsevier.
Figure 3
Figure 3
SEM images showing the effect of calcinations on ZnO particles in air for 3 h at (a) 550 °C; (b) 700 °C; or (c) 800 °C; (d) XRD patterns of the powders after calcination of the powders in air for 3 h; (e) Schematic illustration of the procedure for achieving surface texturing of a single-crystalline ZnO nanorod. Figure adapted from [38] with permission from copyright (2011), American Chemical Society (Washington, DC, USA).
Figure 3
Figure 3
SEM images showing the effect of calcinations on ZnO particles in air for 3 h at (a) 550 °C; (b) 700 °C; or (c) 800 °C; (d) XRD patterns of the powders after calcination of the powders in air for 3 h; (e) Schematic illustration of the procedure for achieving surface texturing of a single-crystalline ZnO nanorod. Figure adapted from [38] with permission from copyright (2011), American Chemical Society (Washington, DC, USA).
Figure 4
Figure 4
(a) Current-voltage responses for various concentrations of nitroaniline; and (b) Calibration curve for nitroaniline using ZnO-doped CeO2 nanoparticles-modified silver electrode (AgE); (c) A proposed sensing mechanism for the ZnO-doped CeO2 nanoparticles-modified AgE toward nitroaniline sensing. Adapted figure from [69] with permission from copyright (2016), Elsevier.
Figure 5
Figure 5
A sensing mechanism for nitroaniline sensing using modified GCE with CdO-ZnO hexagonal nanocones. Adapted figure from [70] with permission from copyright (2017), Elsevier.
Figure 6
Figure 6
A schematic representation of the electrochemical sensing mechanism for the Sm2O3-doped ZnO beech fern hierarchical structures-modified AgE toward nitroaniline sensing. Adapted figure from [71] with permission from copyright (2017), Elsevier.
Figure 7
Figure 7
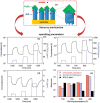
(a) Schematic representation of the main phenomena beneficially affecting the sensing behavior of the present Co3O4/ZnO nanocomposites. Sensing responses (black) of a Co3O4/ZnO sensor (specimen ZnCo10) toward square concentration pulses (blue) of (b) CH3COCH3; (c) CH3CH2OH; and (d) NO2. Working temperatures were (a) 400 °C and (b) 200 °C; (e) Dependence of the response on the operating temperature for selected analyte concentrations (specimen ZnCo10). Adapted figure from [81] with permission from copyright (2012), American Chemical Society (Washington, DC, USA).
Figure 8
Figure 8
Response of the present ZnO to 10 ppm ethanol at various operating temperatures of (a) 220; (b) 250; and (c) 300 °C. The inset shows the sensitivity to 10 ppm ethanol at operating temperatures in the range of 200–350 °C. Adapted figure from [83] with permission from copyright (2009), American Chemical Society (Washington, DC, USA).
Figure 9
Figure 9
SEM images of the samples: precursor (A,B); ZnO-350 (C,D); ZnO-450 (E); and ZnO-550 (F), the inset in C presents a hollow structure of the ZnO-350; (G) ZnO sensors response to 50 ppm ethanol under different operating temperature; (H) Response of ZnO-350 dandelion-like hierarchitectures toward 50 ppm of different interfering molecules at the optimum operating temperature of 250 °C; (I) Response curve and linear fitting curve of the sensing response of ZnO-350 to different concentrations of ethanol at the operating temperature of 250 °C; (J) response and recovery time of ZnO-350 to 50 ppm ethanol at the operating temperature of 250 °C. Adapted figure from [84] with permission from copyright (2014), American Chemical Society, (Washington, DC, USA).
Figure 9
Figure 9
SEM images of the samples: precursor (A,B); ZnO-350 (C,D); ZnO-450 (E); and ZnO-550 (F), the inset in C presents a hollow structure of the ZnO-350; (G) ZnO sensors response to 50 ppm ethanol under different operating temperature; (H) Response of ZnO-350 dandelion-like hierarchitectures toward 50 ppm of different interfering molecules at the optimum operating temperature of 250 °C; (I) Response curve and linear fitting curve of the sensing response of ZnO-350 to different concentrations of ethanol at the operating temperature of 250 °C; (J) response and recovery time of ZnO-350 to 50 ppm ethanol at the operating temperature of 250 °C. Adapted figure from [84] with permission from copyright (2014), American Chemical Society, (Washington, DC, USA).
Figure 10
Figure 10
(a) Electron carrier concentration, resistivity, and Hall mobility of the 3 dimentional macroporous structures; the error bars represent the SD of the determinations for three independent samples; (b) Schematic diagram of ethanol sensing on the surface of pure and In-doped 3DOM ZnO. Adapted figure from [85] with permission from copyright (2016), American Chemical Society, (Washington, DC, USA).
Figure 11
Figure 11
(a) Cyclic voltammograms obtained for ZnO nanoparticles/GC electrode in 0.1 M PBS (pH = 7.4), containing 5 mM hydroquinone at various scan rates of 10, 50, 70, 90, 100, 200, 300, 400, 500, 1000, 1500, and 2000 mV/s; (b) Plot for the anodic and cathodic peak current versus the square root of the scan rates in the same solution; (c) Plot for the anodic and cathodic peak current versus the scan rates in same solution; and (d) Plot for the anodic and cathodic peak current versus the natural Log of scan rates in the same solution. Adapted figure from [91] with permission from copyright (2014), American Scientific Publishers (Los Angeles, CA, USA).
Figure 11
Figure 11
(a) Cyclic voltammograms obtained for ZnO nanoparticles/GC electrode in 0.1 M PBS (pH = 7.4), containing 5 mM hydroquinone at various scan rates of 10, 50, 70, 90, 100, 200, 300, 400, 500, 1000, 1500, and 2000 mV/s; (b) Plot for the anodic and cathodic peak current versus the square root of the scan rates in the same solution; (c) Plot for the anodic and cathodic peak current versus the scan rates in same solution; and (d) Plot for the anodic and cathodic peak current versus the natural Log of scan rates in the same solution. Adapted figure from [91] with permission from copyright (2014), American Scientific Publishers (Los Angeles, CA, USA).
Figure 12
Figure 12
(a) Dynamic responses to acetone at concentrations ranging from 10 to 500 ppm of acetone sensors made with Pd−ZnO−Nnanosphere and ZnO−nanosphere at optimized operating temperatures. The inset shows response vs concentration curves of the corresponding sensors; (b) Stability studies of sensors exposed to 100 ppm acetone; (c) The selectivity of the acetone sensors to reducing gases; and (d) The corresponding normalized selectivity of sensors from (c). Adapted figure from [92] with permission from copyright (2012), American Chemical Society (Washington, DC, USA).
Figure 13
Figure 13
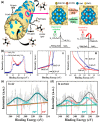
(a) Schematic illustration of acetone-sensing mechanism for PdO@ZnO–SnO2 nanotubes NTs; (b) (i) ultraviolet photoelectron spectroscopy (UPS) spectrum of SnO2 NTs and PdO@ZnO–SnO2 NTs ((ii) high-binding-energy region and (iii) low-binding-energy region) and ex situ X-ray photoelectron spectroscopy (XPS) analysis using high-resolution spectra of PdO@ZnO–SnO2 NTs in the vicinity of Pd 3d (c) in air and (d) in acetone after a seven-cycle sensing measurement with 5 ppm of acetone at 400 °C. Adapted figure from [96] with permission from copyright (2017), American Chemical Society (Washington, DC, USA).
Figure 14
Figure 14
(a) Schematic illustration of the sensor fabrication process: composite layer, containing piezoelectric Li-doped ZnO NWs and PDMS, is sandwiched between two poly (3,4-ethylenedioxythiophene) polystyrene sulfonate (PEDOT:PSS)-coated Ag NW electrodes embedded in the PDMS; (b) SEM of the AgNW network, which is seamlessly connected on the PDMS surface. The inset shows a magnified view of the Ag NWs on the PDMS; (c) Schematic representation of the sensor device consisting of two main parts: resistive and piezoelectric sensing elements. The inset shows the flexibility of the device; (d) Cross-section of the device SEM; (e) SEM of as-synthesized Li-doped ZnO NWs; (f) photoluminescence (PL) spectra of undoped ZnO NWs, and (g) Li-doped ZnO NWs. The yellow emission explicitly indicates the Li-doping in ZnO. Adapted figure from [97] with permission from copyright (2017), American Chemical Society (Washington, DC, USA).
Figure 15
Figure 15
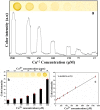
(a) Color intensity versus the Cu2+ ions concentration obtained by ImageJ with a digital photograph as an inset; (b) The color intensity versus the Cu2+ ions concentration; and (c) The calibration curve of the color intensity at different concentrations of the Cu2+ ions. Adapted figure from [103] with permission from copyright (2014), American Chemical Society (Washington, DC, USA).
Figure 16
Figure 16
(A) Schematic of light scattering occurring on a ZnO/CdS-modified electrode; (B) Electron–hole pairs generation, separation, and transfer between ZnO and CdS at a ZnO/CdS-modified electrode for the sensing of Cu2+ ions where CB and VB are the conduction and valence band. ITO is Indium tin oxide. Adapted figure from [105] with permission from copyright (2011), American Chemical Society, (Washington, DC, USA).

References

    1. Ebrahimiasl S., Seifi R., Nahli R.E., Azmi Zakaria A. Ppy/nanographene modified pencil graphite electrode nanosensor for detection and determination of herbicides in agricultural water. Sci. Adv. Mater. 2017;9:2045–2053.
    1. Xiang C., Wang Y., Liu H. A scientometrics review on nonpoint source pollution research. Ecol. Eng. 2017;99:400–408. doi: 10.1016/j.ecoleng.2016.11.028. - DOI
    1. Martinez D.E., Grondona S., Miglioranza K.S.B., Postigo C. Groundwater pollution sources, mechanisms, and prevention. Encycl. Anthr. 2018;5:87–96.
    1. Uma B.B., Uday S.P., Oinam G., Mondal A., Bandyopadhyay T.K., Tiwari O.N. Characterization, genetic regulation and production of cyanobacterial exopolysaccharides and its applicability for heavy metal removal. Carbohydr. Polym. 2018;179:228–243. - PubMed
    1. Song J.F., Lin Z.Z., Ge S., Li J., Qiu X.M., Zhou R.S., Li S.Z., Guo Z. Dispersible novel naphthalene-2,6-dicarboxylic acid monomethyl ester-based coordination polymers through in situ hydrolysis reaction: Highly sensitive detection of small molecules and metal ions. Sci. Adv. Mater. 2017;9:2054–2065.

LinkOut - more resources