Does exposure to simulated patient cases improve accuracy of clinicians' predictive value estimates of diagnostic test results? A within-subjects experiment at St Michael's Hospital, Toronto, Canada
- PMID: 29440215
- PMCID: PMC5829891
- DOI: 10.1136/bmjopen-2017-019241
Does exposure to simulated patient cases improve accuracy of clinicians' predictive value estimates of diagnostic test results? A within-subjects experiment at St Michael's Hospital, Toronto, Canada
Abstract
Objective: Clinicians often overestimate the probability of a disease given a positive test result (positive predictive value; PPV) and the probability of no disease given a negative test result (negative predictive value; NPV). The purpose of this study was to investigate whether experiencing simulated patient cases (ie, an 'experience format') would promote more accurate PPV and NPV estimates compared with a numerical format.
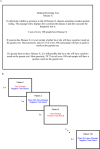
Design: Participants were presented with information about three diagnostic tests for the same fictitious disease and were asked to estimate the PPV and NPV of each test. Tests varied with respect to sensitivity and specificity. Information about each test was presented once in the numerical format and once in the experience format. The study used a 2 (format: numerical vs experience) × 3 (diagnostic test: gold standard vs low sensitivity vs low specificity) within-subjects design.
Setting: The study was completed online, via Qualtrics (Provo, Utah, USA).
Participants: 50 physicians (12 clinicians and 38 residents) from the Department of Family and Community Medicine at St Michael's Hospital in Toronto, Canada, completed the study. All participants had completed at least 1 year of residency.
Results: Estimation accuracy was quantified by the mean absolute error (MAE; absolute difference between estimate and true predictive value). PPV estimation errors were larger in the numerical format (MAE=32.6%, 95% CI 26.8% to 38.4%) compared with the experience format (MAE=15.9%, 95% CI 11.8% to 20.0%, d=0.697, P<0.001). Likewise, NPV estimation errors were larger in the numerical format (MAE=24.4%, 95% CI 14.5% to 34.3%) than in the experience format (MAE=11.0%, 95% CI 6.5% to 15.5%, d=0.303, P=0.015).
Conclusions: Exposure to simulated patient cases promotes accurate estimation of predictive values in clinicians. This finding carries implications for diagnostic training and practice.
Keywords: diagnostic inference; estimate accuracy; experience-based learning; npv; ppv.
© Article author(s) (or their employer(s) unless otherwise stated in the text of the article) 2018. All rights reserved. No commercial use is permitted unless otherwise expressly granted.
Conflict of interest statement
Competing interests: None declared.
Figures


Similar articles
-
Aiding Risk Information learning through Simulated Experience (ARISE): A Comparison of the Communication of Screening Test Information in Explicit and Simulated Experience Formats.Med Decis Making. 2019 Apr;39(3):196-207. doi: 10.1177/0272989X19832882. Epub 2019 Feb 28. Med Decis Making. 2019. PMID: 30819033
-
Physician and Nonphysician Estimates of Positive Predictive Value in Diagnostic v. Mass Screening Mammography: An Examination of Bayesian Reasoning.Med Decis Making. 2019 Feb;39(2):108-118. doi: 10.1177/0272989X18823757. Epub 2019 Jan 24. Med Decis Making. 2019. PMID: 30678607
-
Parental recognition of shunt failure: a prospective single-institution study.J Neurosurg Pediatr. 2012 Apr;9(4):363-71. doi: 10.3171/2011.12.PEDS11291. J Neurosurg Pediatr. 2012. PMID: 22462699
-
Quantifying how tests reduce diagnostic uncertainty.Arch Dis Child. 2007 May;92(5):404-8. doi: 10.1136/adc.2006.111633. Epub 2006 Dec 11. Arch Dis Child. 2007. PMID: 17158858 Free PMC article. Review.
-
Diagnostic value and accuracy of imprint cytology evaluation during image-guided core needle biopsies: Review of our experience at a large academic center.Diagn Cytopathol. 2015 Oct;43(10):773-9. doi: 10.1002/dc.23300. Epub 2015 Jun 27. Diagn Cytopathol. 2015. PMID: 26119885 Review.
Cited by
-
Decision aids to prepare patients for shared decision making: Two randomized controlled experiments on the impact of awareness of preference-sensitivity and personal motives.Health Expect. 2021 Apr;24(2):257-268. doi: 10.1111/hex.13159. Epub 2021 Jan 31. Health Expect. 2021. PMID: 33517579 Free PMC article. Clinical Trial.
-
On the round number bias and wisdom of crowds in different response formats for numerical estimation.Sci Rep. 2022 May 17;12(1):8167. doi: 10.1038/s41598-022-11900-7. Sci Rep. 2022. PMID: 35581220 Free PMC article.
-
Methods to Improve Diagnostic Reasoning in Undergraduate Medical Education in the Clinical Setting: a Systematic Review.J Gen Intern Med. 2021 Sep;36(9):2745-2754. doi: 10.1007/s11606-021-06916-0. Epub 2021 Jun 22. J Gen Intern Med. 2021. PMID: 34159542 Free PMC article.
References
-
- Dowie J, Elstein A, Professional judgment: a reader in clinical decision making. Cambridge: Cambridge University Press, 1988.
Publication types
MeSH terms
LinkOut - more resources
Full Text Sources
Other Literature Sources
Medical
Molecular Biology Databases
