Comprehensive characterisation of compartment-specific long non-coding RNAs associated with pancreatic ductal adenocarcinoma
- PMID: 29440233
- PMCID: PMC6086768
- DOI: 10.1136/gutjnl-2017-314353
Comprehensive characterisation of compartment-specific long non-coding RNAs associated with pancreatic ductal adenocarcinoma
Erratum in
-
Correction: Comprehensive characterisation of compartment-specific long non-coding RNAs associated with pancreatic ductal adenocarcinoma.Gut. 2019 May;68(5):952. doi: 10.1136/gutjnl-2017-314353corr1. Epub 2019 Mar 2. Gut. 2019. PMID: 30826746 No abstract available.
Abstract
Objective: Pancreatic ductal adenocarcinoma (PDA) is a highly metastatic disease with limited therapeutic options. Genome and transcriptome analyses have identified signalling pathways and cancer driver genes with implications in patient stratification and targeted therapy. However, these analyses were performed in bulk samples and focused on coding genes, which represent a small fraction of the genome.
Design: We developed a computational framework to reconstruct the non-coding transcriptome from cross-sectional RNA-Seq, integrating somatic copy number alterations (SCNA), common germline variants associated to PDA risk and clinical outcome. We validated the results in an independent cohort of paired epithelial and stromal RNA-Seq derived from laser capture microdissected human pancreatic tumours, allowing us to annotate the compartment specificity of their expression. We employed systems and experimental biology approaches to interrogate the function of epithelial long non-coding RNAs (lncRNAs) associated with genetic traits and clinical outcome in PDA.
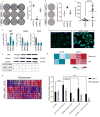
Results: We generated a catalogue of PDA-associated lncRNAs. We showed that lncRNAs define molecular subtypes with biological and clinical significance. We identified lncRNAs in genomic regions with SCNA and single nucleotide polymorphisms associated with lifetime risk of PDA and associated with clinical outcome using genomic and clinical data in PDA. Systems biology and experimental functional analysis of two epithelial lncRNAs (LINC00673 and FAM83H-AS1) suggest they regulate the transcriptional profile of pancreatic tumour samples and PDA cell lines.
Conclusions: Our findings indicate that lncRNAs are associated with genetic marks of pancreatic cancer risk, contribute to the transcriptional regulation of neoplastic cells and provide an important resource to design functional studies of lncRNAs in PDA.
Keywords: RNA expression; cancer genetics; epithelial cells; gene regulation; pancreatic cancer.
© Article author(s) (or their employer(s) unless otherwise stated in the text of the article) 2019. All rights reserved. No commercial use is permitted unless otherwise expressly granted.
Conflict of interest statement
Competing interests: None declared.
Figures


Similar articles
-
Long non-coding RNAs expressed in pancreatic ductal adenocarcinoma and lncRNA BC008363 an independent prognostic factor in PDAC.Pancreatology. 2014 Sep-Oct;14(5):385-90. doi: 10.1016/j.pan.2014.07.013. Epub 2014 Aug 12. Pancreatology. 2014. PMID: 25200694
-
Single-cell transcriptome analysis of tumor and stromal compartments of pancreatic ductal adenocarcinoma primary tumors and metastatic lesions.Genome Med. 2020 Sep 29;12(1):80. doi: 10.1186/s13073-020-00776-9. Genome Med. 2020. PMID: 32988401 Free PMC article.
-
Orchestrating a biomarker panel with lncRNAs and mRNAs for predicting survival in pancreatic ductal adenocarcinoma.J Cell Biochem. 2018 Sep;119(9):7696-7706. doi: 10.1002/jcb.27119. Epub 2018 Jun 20. J Cell Biochem. 2018. PMID: 29923223
-
Long noncoding RNAs: role and contribution in pancreatic cancer.Transcription. 2021 Feb;12(1):12-27. doi: 10.1080/21541264.2021.1922071. Epub 2021 May 26. Transcription. 2021. PMID: 34036896 Free PMC article. Review.
-
The implication of long non-coding RNAs in the diagnosis, pathogenesis and drug resistance of pancreatic ductal adenocarcinoma and their possible therapeutic potential.Biochim Biophys Acta Rev Cancer. 2020 Dec;1874(2):188423. doi: 10.1016/j.bbcan.2020.188423. Epub 2020 Aug 29. Biochim Biophys Acta Rev Cancer. 2020. PMID: 32871244 Review.
Cited by
-
Macrophage-secreted MMP9 induces mesenchymal transition in pancreatic cancer cells via PAR1 activation.Cell Oncol (Dordr). 2020 Dec;43(6):1161-1174. doi: 10.1007/s13402-020-00549-x. Epub 2020 Aug 18. Cell Oncol (Dordr). 2020. PMID: 32809114 Free PMC article.
-
Web tools to perform long non-coding RNAs analysis in oncology research.Database (Oxford). 2021 Jul 23;2021:baab047. doi: 10.1093/database/baab047. Database (Oxford). 2021. PMID: 34296748 Free PMC article. Review.
-
Drivers of Gene Expression Dysregulation in Pancreatic Cancer.Trends Cancer. 2021 Jul;7(7):594-605. doi: 10.1016/j.trecan.2021.01.008. Epub 2021 Feb 19. Trends Cancer. 2021. PMID: 33618999 Free PMC article. Review.
-
Impact of LINC00673 genetic variants on uterine cervical cancer clinicopathologic characteristics.J Cancer. 2023 Aug 15;14(13):2529-2537. doi: 10.7150/jca.86678. eCollection 2023. J Cancer. 2023. PMID: 37670967 Free PMC article.
-
Defining the KRAS- and ERK-dependent transcriptome in KRAS-mutant cancers.Science. 2024 Jun 7;384(6700):eadk0775. doi: 10.1126/science.adk0775. Epub 2024 Jun 7. Science. 2024. PMID: 38843331 Free PMC article.
References
-
- Rahib L, Smith BD, Aizenberg R, Rosenzweig AB, Fleshman JM, Matrisian LM. Projecting cancer incidence and deaths to 2030: the unexpected burden of thyroid, liver, and pancreas cancers in the United States. Cancer research. 2014;74(11):2913–21. - PubMed
-
- Siegel RL, Miller KD, Jemal A. Cancer Statistics, 2017. CA Cancer J Clin. 2017;67(1):7–30. - PubMed
-
- Bailey P, Chang DK, Nones K, Johns AL, Patch AM, Gingras MC, et al. Genomic analyses identify molecular subtypes of pancreatic cancer. Nature. 2016;531(7592):47–52. - PubMed
Publication types
MeSH terms
Substances
Grants and funding
LinkOut - more resources
Full Text Sources
Other Literature Sources
Medical
Molecular Biology Databases
Miscellaneous
