. 2018 Jan 15;32(2):140-155.
doi: 10.1101/gad.307884.117. Epub 2018 Feb 12.

Calcitonin receptors are ancient modulators for rhythms of preferential temperature in insects and body temperature in mammals

Affiliations

Calcitonin receptors are ancient modulators for rhythms of preferential temperature in insects and body temperature in mammals

Tadahiro Goda et al. Genes Dev. .

Abstract

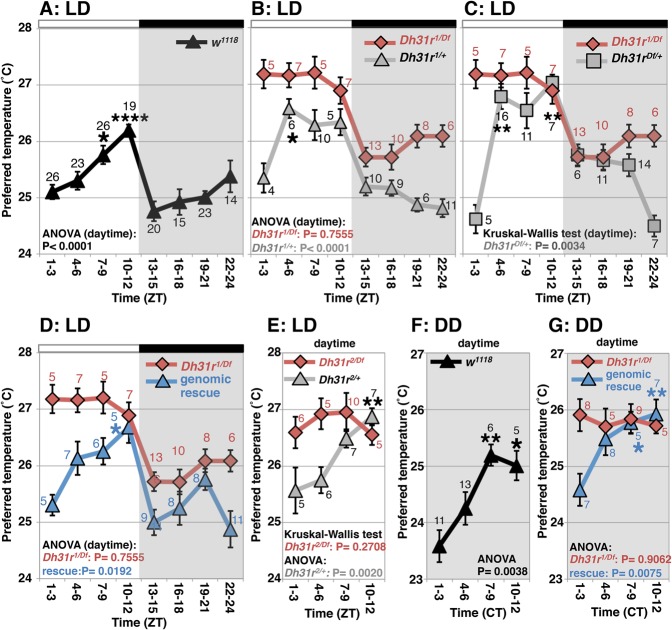
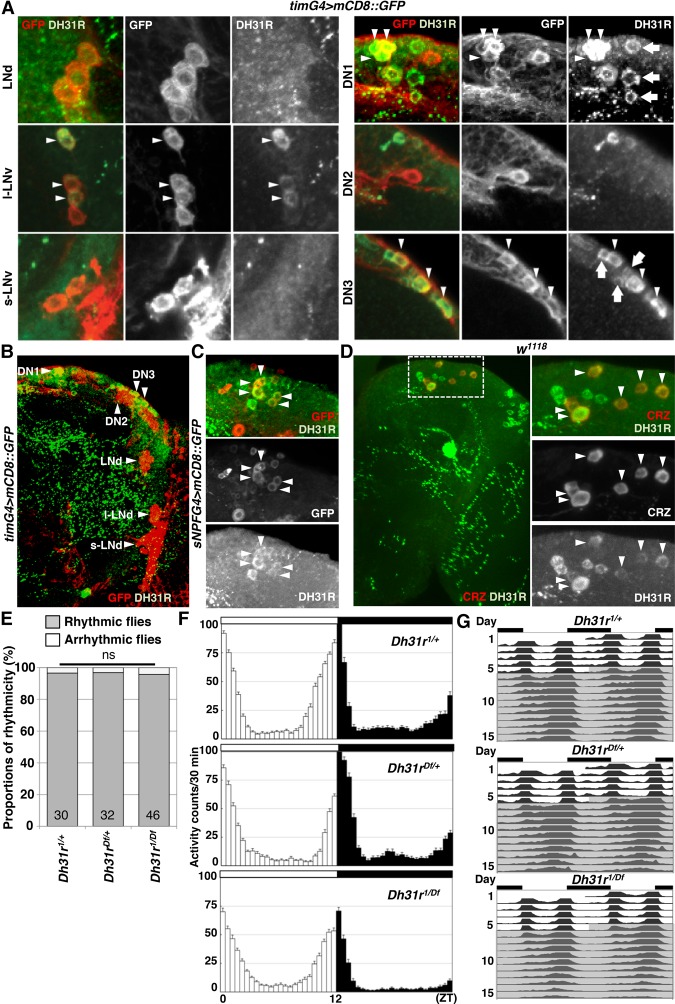
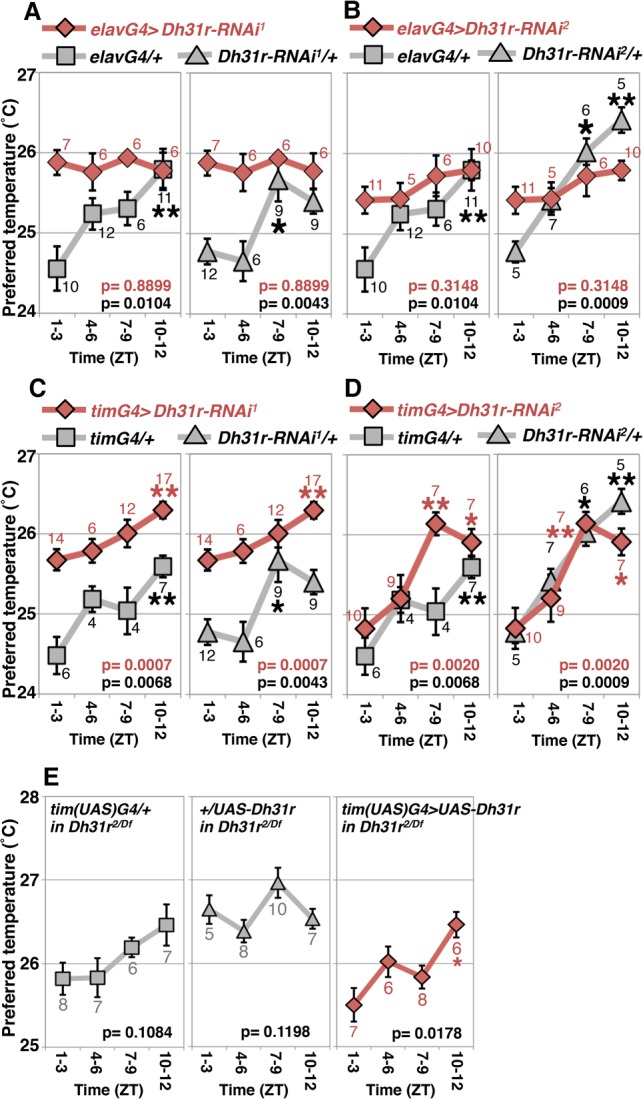
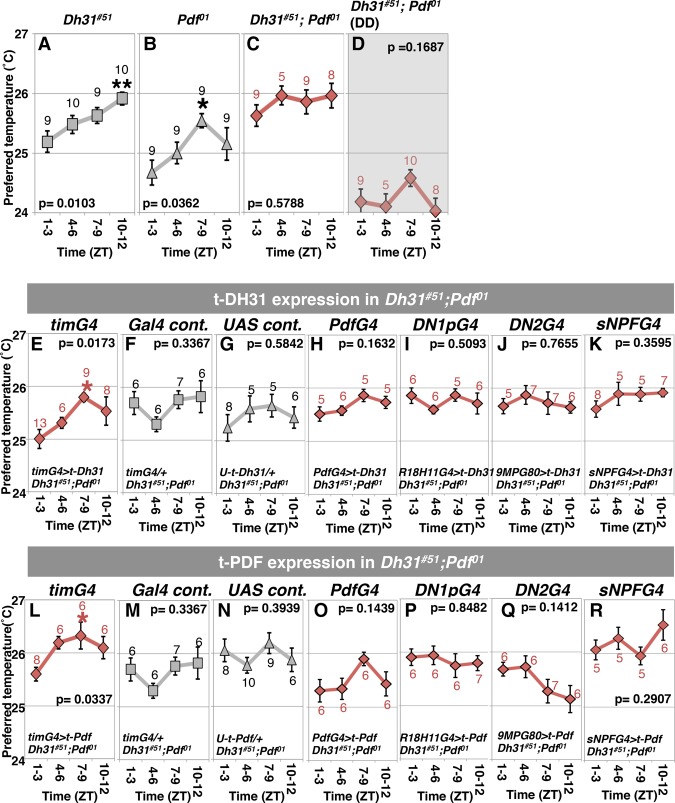
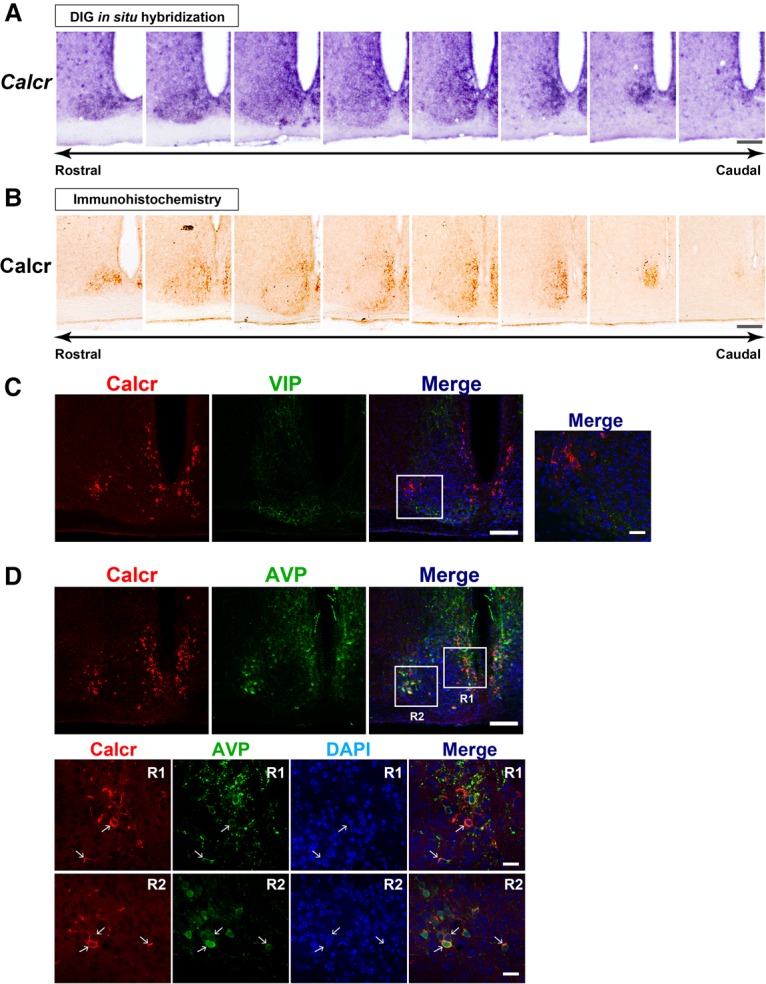
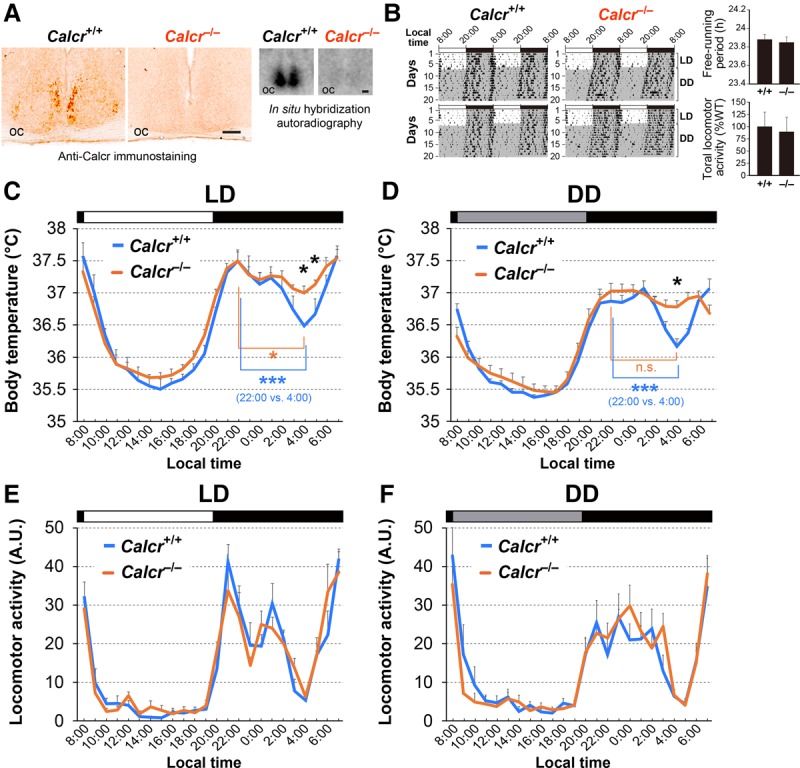
Daily body temperature rhythm (BTR) is essential for maintaining homeostasis. BTR is regulated separately from locomotor activity rhythms, but its molecular basis is largely unknown. While mammals internally regulate BTR, ectotherms, including Drosophila, exhibit temperature preference rhythm (TPR) behavior to regulate BTR. Here, we demonstrate that the diuretic hormone 31 receptor (DH31R) mediates TPR during the active phase in Drosophila DH31R is expressed in clock cells, and its ligand, DH31, acts on clock cells to regulate TPR during the active phase. Surprisingly, the mouse homolog of DH31R, calcitonin receptor (Calcr), is expressed in the suprachiasmatic nucleus (SCN) and mediates body temperature fluctuations during the active phase in mice. Importantly, DH31R and Calcr are not required for coordinating locomotor activity rhythms. Our results represent the first molecular evidence that BTR is regulated distinctly from locomotor activity rhythms and show that DH31R/Calcr is an ancient specific mediator of BTR during the active phase in organisms ranging from ectotherms to endotherms.

Keywords: Calcr; DH31R; body temperature rhythm; calcitonin receptor; circadian rhythm; temperature preference rhythm; thermoregulation.


Figures

Figure 1.
Figure 1.
Dh31r mediates daytime TPR. TPR in Dh31r mutants and controls under 12-h light:12-h dark (LD) cycles (AE) and constant darkness (DD) conditions (F,G). (A) TPR in w1118 flies. (B) Comparison of TPR between the Dh31r mutant Dh31r1/Df (red line) and the heterozygous control Dh31r1/+ (gray line). (C) Comparison of TPR between Dh31r1/Df (red line) and the heterozygous control Dh31rDf/+ (gray line). (D) Comparison of TPR between Dh31r1/Df (red line) and the genomic rescue mutant (rescue [Dh31r], Dh31r1/Df) (blue line). (E) Comparison of TPR between the Dh31r mutant Dh31r2/Df (red line) and its control, Dh31r2/+ (gray line). (F) TPR in w1118 flies in DD. (G) Comparison of TPR between Dh31r1/Df (red line) and the genomic rescue mutant (blue line) in DD. (ZT0) Lights on; (ZT12) lights off; (CT) circadian time; (CT0–CT12) subjective day; (CT13–CT24) subjective night. The daytime shown is from ZT1–ZT3 to ZT10–ZT12. The numbers represent the number of assays. The results of one-way ANOVA or the Kruskal-Wallis test for the data obtained during the daytime are shown. (****) P < 0.0001; (**) P < 0.01; (*) P < 0.05, the Tukey-Kramer test or Kruskal-Wallis test compared with ZT1–ZT3 (Supplemental Table S1).
Figure 2.
Figure 2.
DH31R is expressed in clock cells but is not required for locomotor activity rhythms. (A,B) DH31R antibody staining using a timG4>mCD8::GFP (tim-Gal4/+; UAS-mCD8::GFP/+) fly brain. The clock cells are labeled by GFP (red), and DH31R signals are shown in green. The arrowheads indicate GFP-expressing clock cells that overlap with cells containing DH31R signals. The arrows indicate DH31R-expressing, GFP-negative cells. (C) DH31R antibody staining using sNPFG4>mCD8::GFP (sNPF-Gal4/+; UAS-mCD8::GFP/+) flies. The sNPF-Gal4-positive cells are labeled by GFP (red), and the DH31R signals are shown in green. The arrowheads indicate GFP-expressing cells that overlap with cells expressing DH31R. (D) DH31R and CRZ antibody staining in w1118 flies. The DH31R signals are shown in green, and the CRZ signals are shown in red. The arrowheads indicate CRZ-expressing cells that overlap with cells expressing DH31R. (E) Comparison of percentages of rhythmic (gray bar) and arrhythmic (white bar) flies between Dh31r mutant (Dh31r1/Df) and control (Dh31r1/+ and Dh31rDf/+) flies. The proportions of rhythmic and arrhythmic flies in DD over 10 d were compared using χ2 analysis. The numbers in the bar graph represent the number of flies. (ns) No significance. (F) The averaged activity profiles over 4 d (day 2–5) in LD conditions for each genotype (Dh31r1/+, Dh31rDf/+, and Dh31r1/Df). The white and black columns indicate the mean activity levels in 30 min during the daytime and nighttime, respectively. The white (daytime) and black (nighttime) bars above the profiles represent the lighting conditions. The number of flies in each genotype is the same as in E. (G) Double-plotted averaged actogram of rhythmic flies over 5 d in LD and 10 d in DD for each genotype (Dh31r1/+, Dh31rDf/+, and Dh31r1/Df). Only the rhythmic flies in E were used.
Figure 3.
Figure 3.
Dh31r expression in clock cells is sufficient for TPR. (AD) Comparison of TPRs during the daytime in RNAi knockdown flies (red line) and control flies (gray line). (A,B) RNAi-mediated knockdown of Dh31r in all neurons using elavG4 (elav-Gal4, a pan-neuronal driver) with Dh31r-RNAi1 (UAS-Dh31r-RNAi1) (A) or Dh31r-RNAi2 (UAS-Dh31r-RNAi2) (B). (C,D) RNAi-mediated knockdown of Dh31r in all clock cells using timG4 (tim-Gal4, an all-clock cell driver) with Dh31r-RNAi1 (UAS-Dh31r-RNAi1) (C) or Dh31r-RNAi2 (UAS-Dh31r-RNAi2) (D). (E) Dh31r expression in all clock cells using tim(UAS)-Gal4 and UAS-Dh31r [tim(UAS)G4>UAS-Dh31r; red line] and the corresponding controls [tim(UAS)G4/+ and UAS-Dh31r/+; gray lines] in the Dh31r2/Df mutant background. The numbers represent the numbers of assays. The results of one-way ANOVA or the Kruskal-Wallis test for the data obtained during the daytime are shown. (**) P < 0.01; (*) P < 0.05, the Tukey-Kramer test or Kruskal-Wallis test compared with ZT1–ZT3 (Supplemental Table S1).
Figure 4.
Figure 4.
The neuropeptide DH31 acts on clock cells to mediate daytime TPR. (AD) TPRs during the daytime. (A) Dh31#51 in LD. (B) Pdf01 in LD. (C) Dh31#51; Pdf01 in LD. (D) Dh31#51; Pdf01 in DD. For Dh31#51 and Pdf01, the same data that are presented in Figure 3, A and B (Goda et al. 2016), are shown. (EK) TPRs during the daytime in Dh31#51; Pdf01 flies with t-Dh31 expression. (E) All clock cells (tim-Gal4>UAS-t-Dh31). (F) tim-Gal4 control (tim-Gal4/+). (G) UAS-t-Dh31 control (UAS-t-Dh31/+). (H) t-Dh31 in LNvs (Pdf-Gal4>UAS-t-Dh31). (I) t-Dh31 in DN1ps (R18H11-Gal4>UAS-t-Dh31). (J) t-Dh31 in DN2s (Clk9M-Gal4; Pdf-Gal80>UAS-t-Dh31). (K) t-Dh31 in sNPF-expressing cells (sNPF-Gal4>UAS-t-Dh31). (LR) TPRs during the daytime in Dh31#51; Pdf01 flies with t-Pdf expression. (L) All clock cells (tim-Gal4>UAS-t-Pdf). (M) tim-Gal4 control (tim-Gal4/+). (N) UAS-t-Pdf control (UAS-t-Pdf/+). (O) t-Pdf in LNvs (Pdf-Gal4>UAS-t-Pdf). (P) t-Pdf in DN1ps (R18H11-Gal4>UAS-t-Pdf). (Q) t-Pdf in DN2s (Clk9M-Gal4; PdfGal80>UAS-t-Pdf). (R) t-Pdf in sNPF-expressing cells (sNPF-Gal4>UAS-t-Pdf). The numbers represent the numbers of assays. The results of one-way ANOVA or the Kruskal-Wallis test for the data obtained during the daytime are shown. (**) P < 0.01; (*) P < 0.05, the Tukey-Kramer test or Kruskal-Wallis test compared with ZT1–ZT3 (Supplemental Table S1).
Figure 5.
Figure 5.
The mouse Calcr is expressed in the SCN shell. (A,B) Topographical distribution of Calcr mRNA (A) and Calcr protein (B) in serial coronal brain sections covering the entire mouse SCN in the rostral–caudal direction. Bar, 100 µm. (C) Double-label confocal immunofluorescence of Calcr and VIP in the mouse SCN. The merged image shows combined images of Calcr-based (red), VIP-based (green), and 4,6-diamino-2-phenylindole (DAPI)-based nuclear staining (blue). The boxed area is enlarged in the right panel. Bars: left, 100 µm; right, 20 µm. (D) Double-label confocal immunofluorescence of Calcr and arginine vasopressin (AVP). The boxes indicate the regions enlarged in the bottom panels. The arrows indicate cells double-immunolabeled for Calcr and AVP. Bars: top, 100 µm; bottom, 20 µm.
Figure 6.
Figure 6.
Calcr knockout mice exhibit an abnormal body temperature during the active phase. (A) Immunohistochemistry (left) and radioisotopic in situ hybridization (right) confirm the deficiency of Calcr protein and transcript levels in Calcr−/− mice in the SCN. Bar, 100 µm. (oc) Optic chiasm. (B) Double-plotted actograms of C57BL/6J-backcrossed Calcr+/+ and Calcr−/− mice over 7 d in LD and 13 d in DD. The periods of darkness are indicated by gray backgrounds. The bar graphs indicate the mean ± SEM of the free-running periods of Calcr+/+ and Calcr−/− mice and their relative total locomotor activity per day. The values were determined based on a 10-d interval taken after 3 d in DD. n = 6 (both genotypes). P = 0.521 for period; P = 0.806 for activity, unpaired t-test. (C,D) Body temperatures of Calcr+/+ and Calcr−/− mice in LD (C) and DD (D), as measured by intra-abdominally implanted thermometers. The body temperatures at each time of day for three consecutive days in LD (C) or DD (D) were averaged and smoothed once with a three-point moving average. The values shown are the mean ± SEM. n = 5 mice for each data point. (Black asterisk) P < 0.05, Calcr+/+ versus Calcr−/− (two-way ANOVA with Bonferroni post hoc test); (blue asterisks) P < 0.001, 22:00 versus 4:00 in Calcr+/+ mice; (orange asterisk) P < 0.05, 22:00 versus 4:00 in Calcr−/− mice; (n.s.) not significant (one-way ANOVA with Bonferroni post hoc test). (E,F) The temporal profiles of Calcr+/+ and Calcr−/− locomotor activity in LD (E) and DD (F). The locomotor activities of Calcr+/+ and Calcr−/− mice at each time of day on three consecutive days were averaged and plotted as the mean ± SEM. n = 5 mice per genotype.

Similar articles

Cited by

References

    1. Abrahamson EE, Moore RY. 2001. Suprachiasmatic nucleus in the mouse: retinal innervation, intrinsic organization and efferent projections. Brain Res 916: 172–191. - PubMed
    1. Abruzzi KC, Zadina A, Luo W, Wiyanto E, Rahman R, Guo F, Shafer O, Rosbash M. 2017. RNA-seq analysis of Drosophila clock and non-clock neurons reveals neuron-specific cycling and novel candidate neuropeptides. PLoS Genet 13: e1006613. - PMC - PubMed
    1. Allada R, Chung BY. 2010. Circadian organization of behavior and physiology in Drosophila. Annu Rev Physiol 72: 605–624. - PMC - PubMed
    1. Aschoff J. 1983. Circadian control of body temperature. J Therm Biol 8: 143–147.
    1. Barsh GS, Schwartz MW. 2002. Genetic approaches to studying energy balance: perception and integration. Nat Rev Genet 3: 589–600. - PubMed

Publication types