

Reduction of Spermidine Content Resulting from Inactivation of Two Arginine Decarboxylases Increases Biofilm Formation in Synechocystis sp. Strain PCC 6803
- PMID: 29440257
- PMCID: PMC5892111
- DOI: 10.1128/JB.00664-17
Reduction of Spermidine Content Resulting from Inactivation of Two Arginine Decarboxylases Increases Biofilm Formation in Synechocystis sp. Strain PCC 6803
Abstract
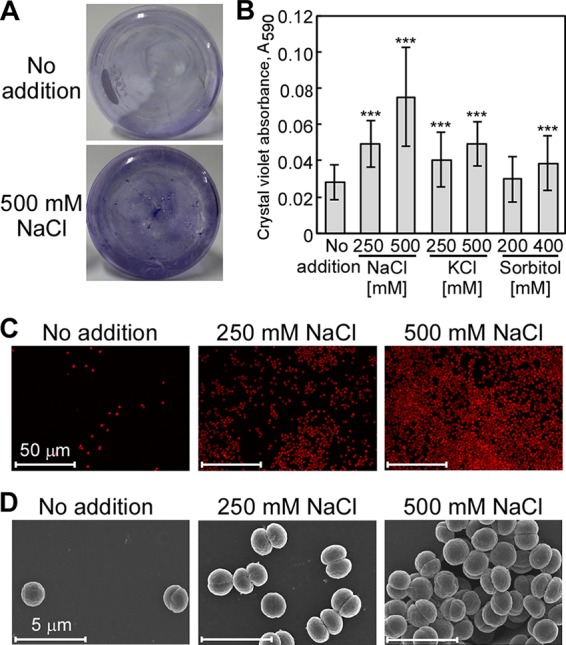
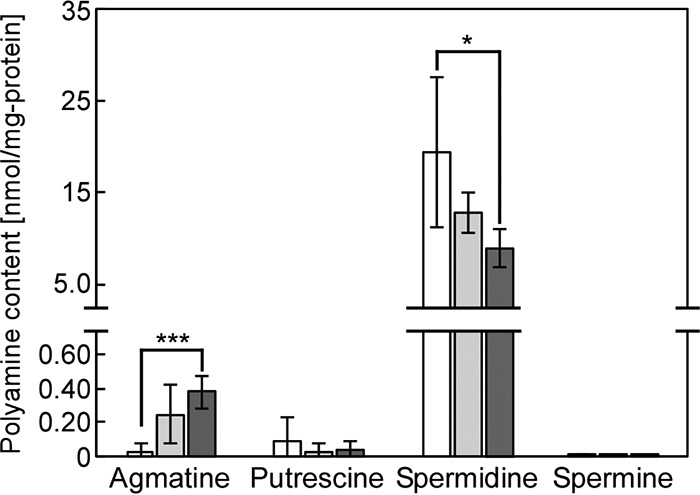
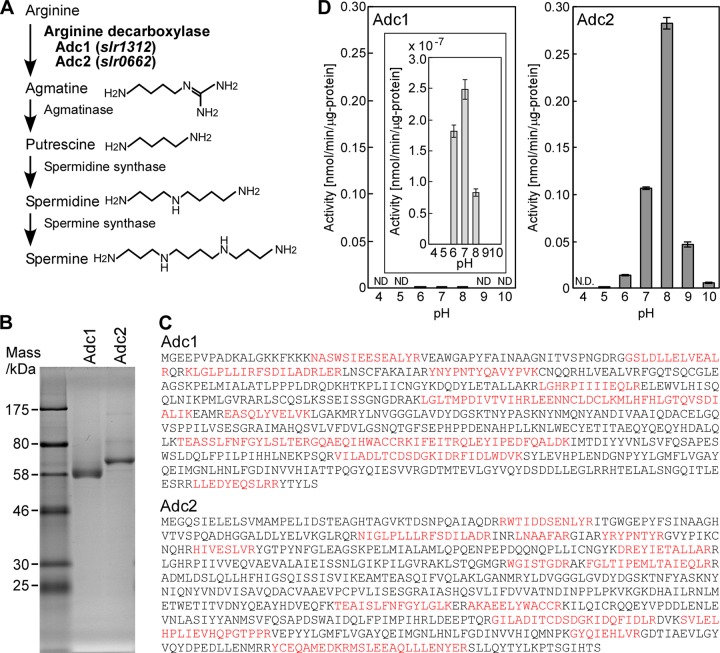
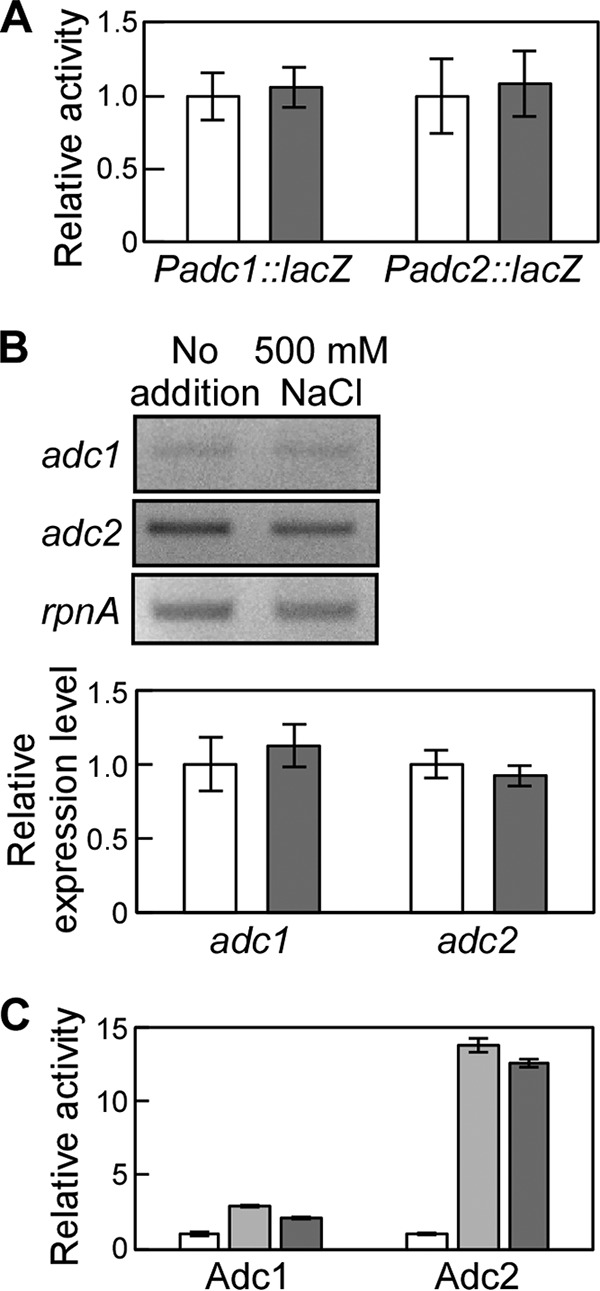
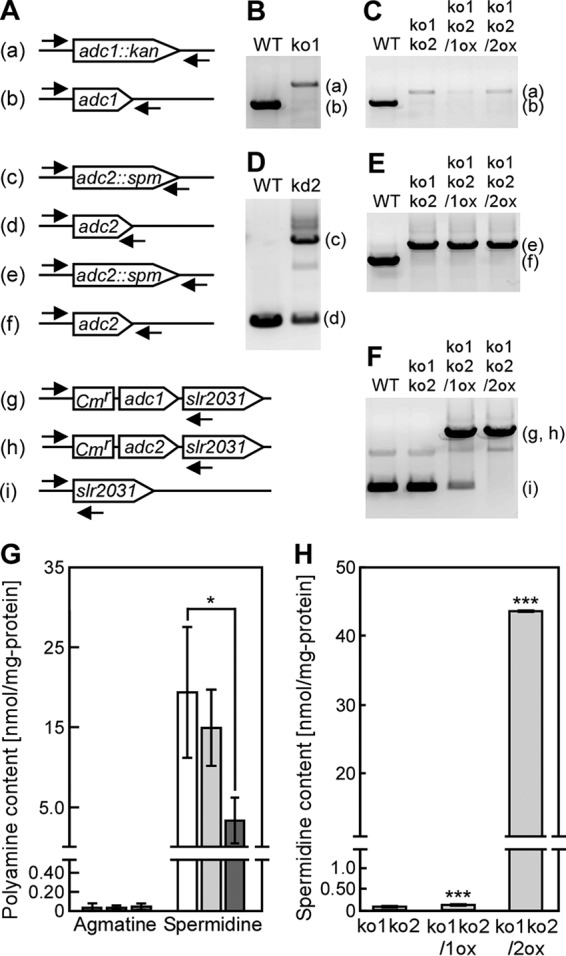
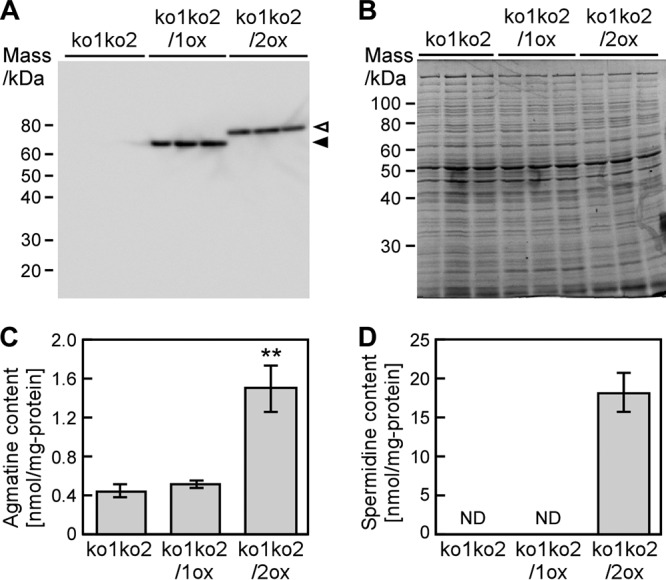
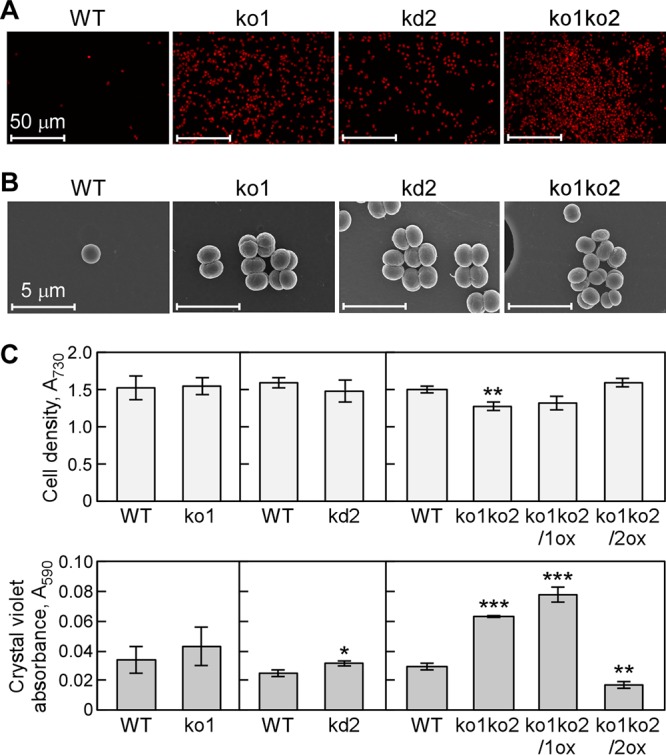
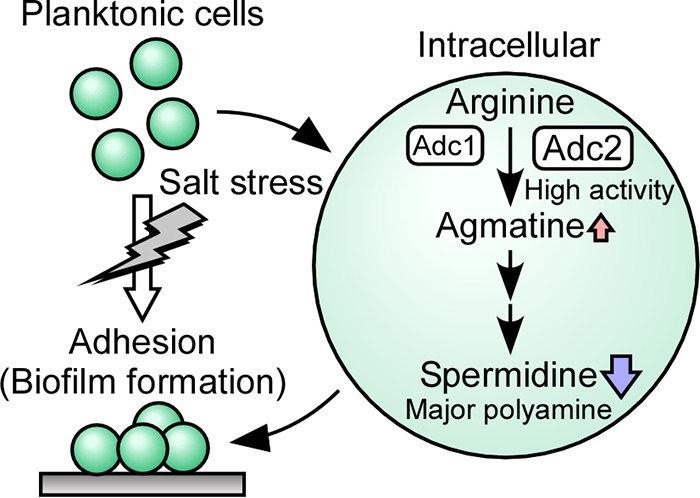
The phototropic bacterium Synechocystis sp. strain PCC 6803 is able to adapt its morphology in order to survive in a wide range of harsh environments. Under conditions of high salinity, planktonic cells formed cell aggregates in culture. Further observations using crystal violet staining, confocal laser scanning microscopy, and field emission-scanning electron microscopy confirmed that these aggregates were Synechocystis biofilms. Polyamines have been implicated in playing a role in biofilm formation, and during salt stress the content of spermidine, the major polyamine in Synechocystis, was reduced. Two putative arginine decarboxylases, Adc1 and Adc2, in Synechocystis were heterologously expressed in Escherichia coli and purified. Adc2 had high arginine decarboxylase activity, whereas Adc1 was much less active. Disruption of the adc genes in Synechocystis resulted in decreased spermidine content and formation of biofilms even under nonstress conditions. Based on the characterization of the adc mutants, Adc2 was the major arginine decarboxylase whose activity led to inhibition of biofilm formation, and Adc1 contributed only minimally to the process of polyamine synthesis. Taken together, in Synechocystis the shift from planktonic lifestyle to biofilm formation was correlated with a decrease in intracellular polyamine content, which is the inverse relationship of what was previously reported in heterotroph bacteria.IMPORTANCE There are many reports concerning biofilm formation in heterotrophic bacteria. In contrast, studies on biofilm formation in cyanobacteria are scarce. Here, we report on the induction of biofilm formation by salt stress in the model phototrophic bacterium Synechocystis sp. strain PCC 6803. Two arginine decarboxylases (Adc1 and Adc2) possess function in the polyamine synthesis pathway. Inactivation of the adc1 and adc2 genes leads to biofilm formation even in the absence of salt. The shift from planktonic culture to biofilm formation is regulated by a decrease in spermidine content in Synechocystis This negative correlation between biofilm formation and polyamine content, which is the opposite of the relationship reported in other bacteria, is important not only in autotrophic but also in heterotrophic bacteria.
Keywords: arginine decarboxylase; biofilm; cyanobacteria; polyamine; stress response.
Copyright © 2018 American Society for Microbiology.
Figures
Similar articles
-
Polyamines induced by osmotic stress protect Synechocystis sp. PCC 6803 cells and arginine decarboxylase transcripts against UV-B radiation.Appl Biochem Biotechnol. 2012 Nov;168(6):1476-88. doi: 10.1007/s12010-012-9871-9. Epub 2012 Sep 16. Appl Biochem Biotechnol. 2012. PMID: 22983741
-
Axenic Biofilm Formation and Aggregation by Synechocystis sp. Strain PCC 6803 Are Induced by Changes in Nutrient Concentration and Require Cell Surface Structures.Appl Environ Microbiol. 2019 Mar 22;85(7):e02192-18. doi: 10.1128/AEM.02192-18. Print 2019 Apr 1. Appl Environ Microbiol. 2019. PMID: 30709828 Free PMC article.
-
Content and biosynthesis of polyamines in salt and osmotically stressed cells of Synechocystis sp. PCC 6803.FEMS Microbiol Lett. 2003 Nov 7;228(1):129-35. doi: 10.1016/S0378-1097(03)00747-X. FEMS Microbiol Lett. 2003. PMID: 14612248
-
Regulation of polyamine biosynthesis by antizyme and some recent developments relating the induction of polyamine biosynthesis to cell growth. Review.Biosci Rep. 1985 Mar;5(3):189-204. doi: 10.1007/BF01119588. Biosci Rep. 1985. PMID: 3893559 Review.
-
Insights on Escherichia coli biofilm formation and inhibition from whole-transcriptome profiling.Environ Microbiol. 2009 Jan;11(1):1-15. doi: 10.1111/j.1462-2920.2008.01768.x. Environ Microbiol. 2009. PMID: 19125816 Free PMC article. Review.
Cited by
-
Hik36-Hik43 and Rre6 act as a two-component regulatory system to control cell aggregation in Synechocystis sp. PCC6803.Sci Rep. 2020 Nov 10;10(1):19405. doi: 10.1038/s41598-020-76264-2. Sci Rep. 2020. PMID: 33173131 Free PMC article.
-
Effect of Spermidine on Biofilm Formation in Escherichia coli K-12.J Bacteriol. 2021 Apr 21;203(10):e00652-20. doi: 10.1128/JB.00652-20. Print 2021 Apr 21. J Bacteriol. 2021. PMID: 33685971 Free PMC article.
-
Control of light-dependent behaviour in cyanobacteria by the second messenger cyclic di-GMP.Microlife. 2023 Apr 12;4:uqad019. doi: 10.1093/femsml/uqad019. eCollection 2023. Microlife. 2023. PMID: 37223735 Free PMC article. Review.
-
Functional investigation of Zur in metal ion homeostasis, motility and multiple stresses resistance in cyanobacteria Synechocystis sp. PCC 6803.Stress Biol. 2025 May 7;5(1):32. doi: 10.1007/s44154-025-00224-x. Stress Biol. 2025. PMID: 40332629 Free PMC article.
-
The mechanosensitive channel YbdG from Escherichia coli has a role in adaptation to osmotic up-shock.J Biol Chem. 2019 Aug 16;294(33):12281-12292. doi: 10.1074/jbc.RA118.007340. Epub 2019 Jun 29. J Biol Chem. 2019. PMID: 31256002 Free PMC article.
References
-
- Los DA, Murata N. 1999. Responses to cold shock in cyanobacteria. J Mol Microbiol Biotechnol 1:221–230. - PubMed
-
- Akai M, Onai K, Kusano M, Sato M, Redestig H, Toyooka K, Morishita M, Miyake H, Hazama A, Checchetto V, Szabo I, Matsuoka K, Saito K, Yasui M, Ishiura M, Uozumi N. 2011. Plasma membrane aquaporin AqpZ protein is essential for glucose metabolism during photomixotrophic growth of Synechocystis sp. PCC. 6803. J Biol Chem 286:25224–25235. - PMC - PubMed
Publication types
MeSH terms
Substances
LinkOut - more resources
Full Text Sources
Other Literature Sources
Molecular Biology Databases
