. 2018 Jan 15;32(2):112-126.
doi: 10.1101/gad.309575.117. Epub 2018 Feb 9.

Three-step transcriptional priming that drives the commitment of multipotent progenitors toward B cells

Affiliations

Three-step transcriptional priming that drives the commitment of multipotent progenitors toward B cells

Tomohiro Miyai et al. Genes Dev. .

Abstract

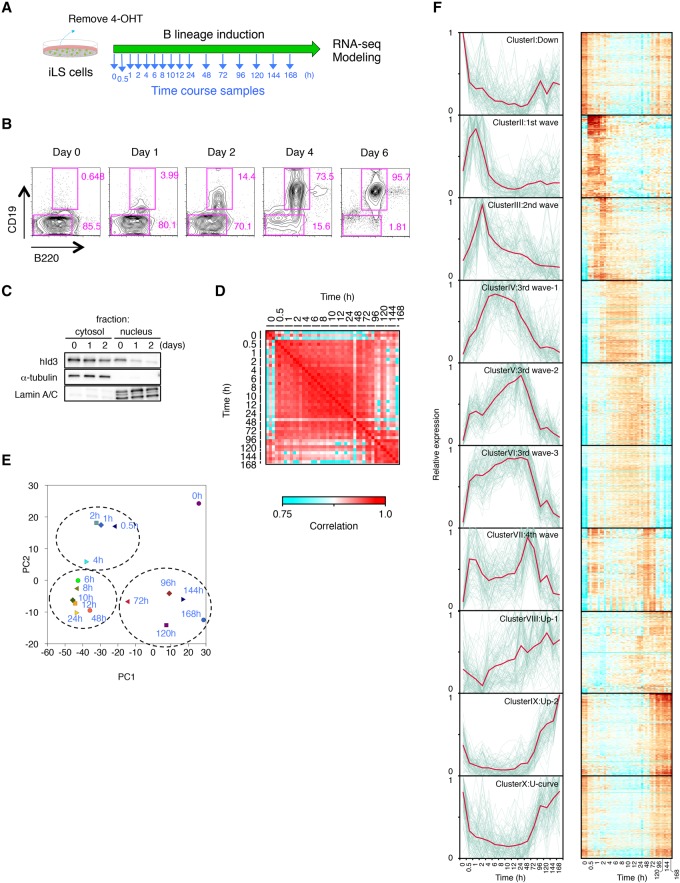
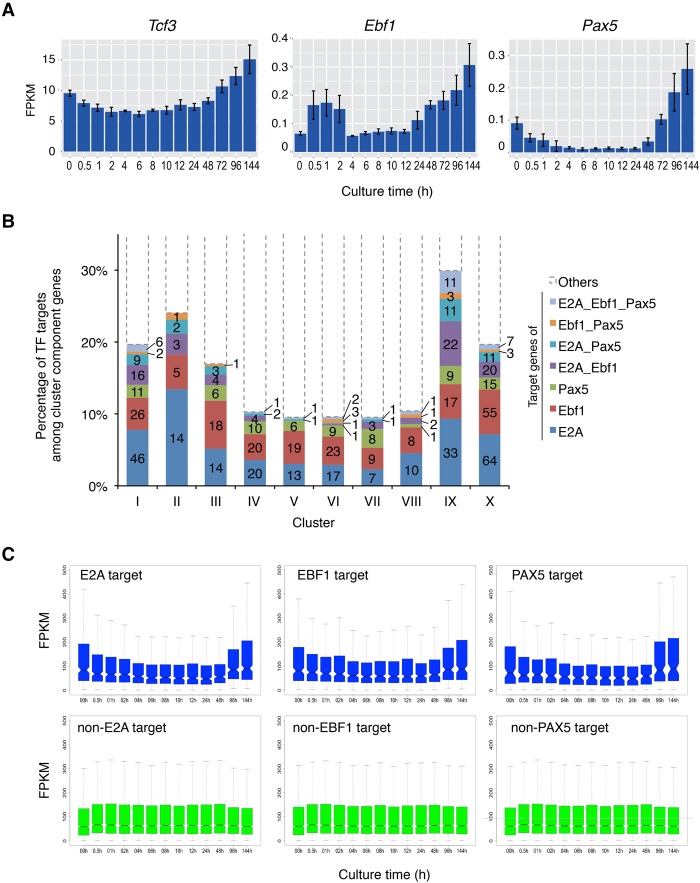
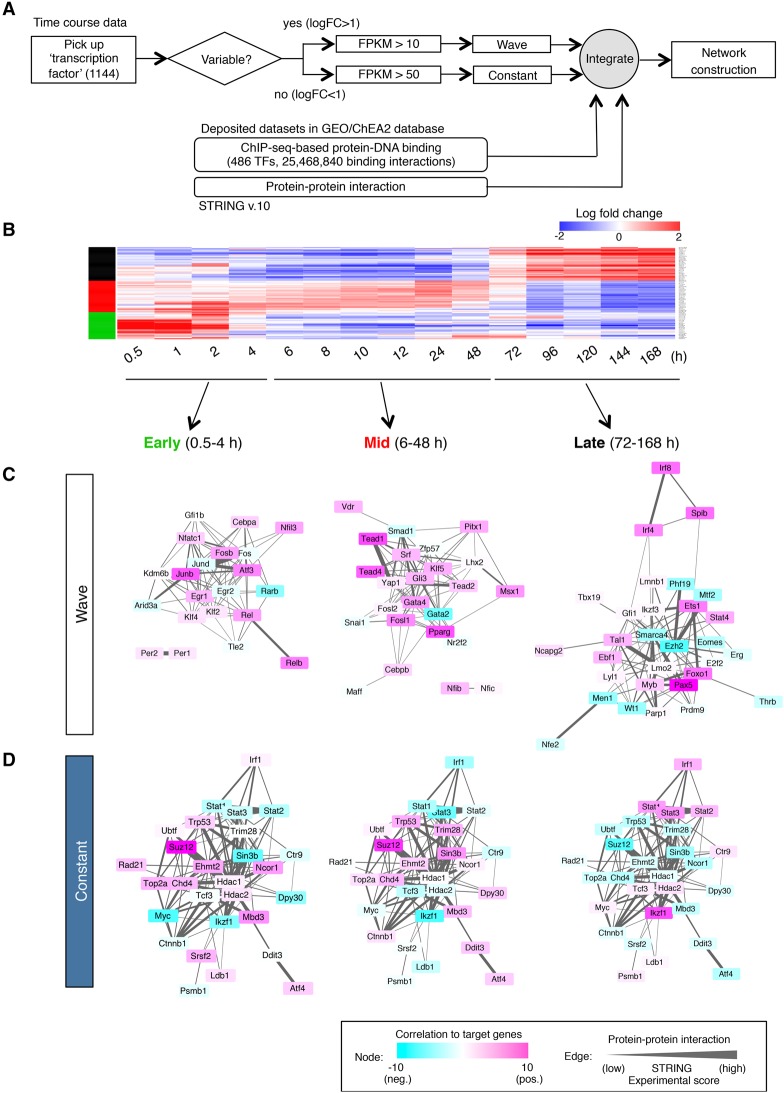
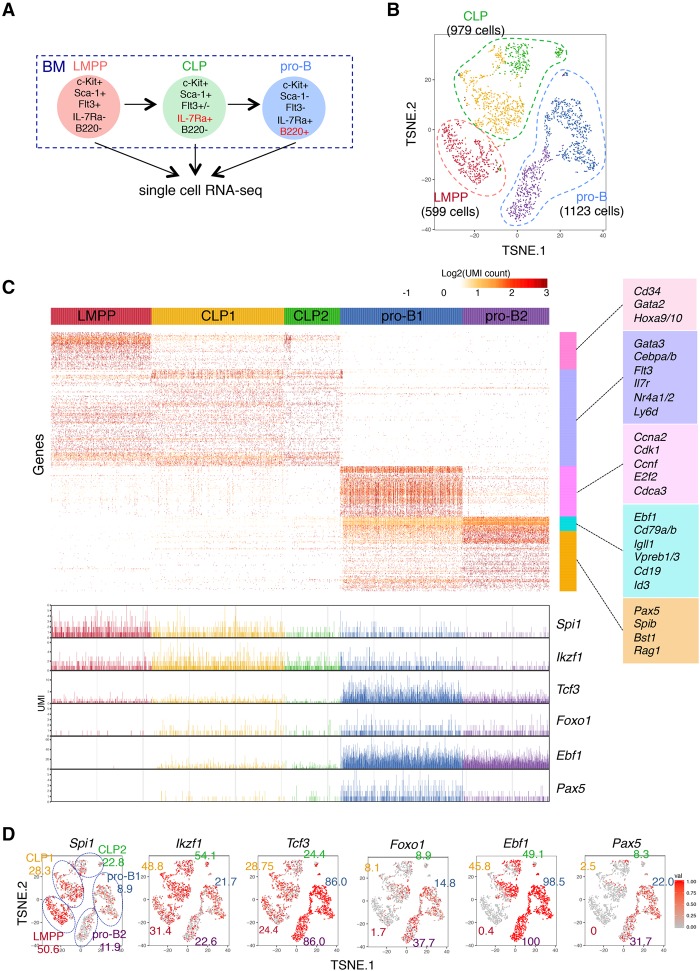
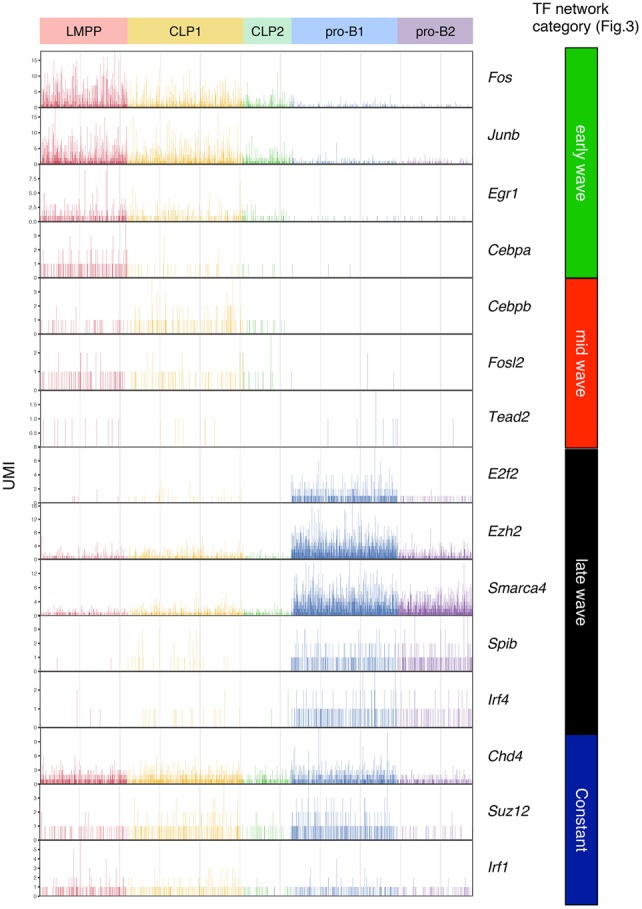
Stem cell fate is orchestrated by core transcription factors (TFs) and epigenetic modifications. Although regulatory genes that control cell type specification are identified, the transcriptional circuit and the cross-talk among regulatory factors during cell fate decisions remain poorly understood. To identify the "time-lapse" TF networks during B-lineage commitment, we used multipotent progenitors harboring a tamoxifen-inducible form of Id3, an in vitro system in which virtually all cells became B cells within 6 d by simply withdrawing 4-hydroxytamoxifen (4-OHT). Transcriptome and epigenome analysis at multiple time points revealed that ∼10%-30% of differentially expressed genes were virtually controlled by the core TFs, including E2A, EBF1, and PAX5. Strikingly, we found unexpected transcriptional priming before the onset of the key TF program. Inhibition of the immediate early genes such as Nr4a2, Klf4, and Egr1 severely impaired the generation of B cells. Integration of multiple data sets, including transcriptome, protein interactome, and epigenome profiles, identified three representative transcriptional circuits. Single-cell RNA sequencing (RNA-seq) analysis of lymphoid progenitors in bone marrow strongly supported the three-step TF network model during specification of multipotent progenitors toward B-cell lineage in vivo. Thus, our findings will provide a blueprint for studying the normal and neoplastic development of B lymphocytes.

Keywords: B-cell differentiation; epigenetics; lineage commitment; single-cell RNA-seq; transcription factor; transcriptional network.


Figures

Figure 1.
Figure 1.
Genome-wide transcriptome analysis using time-course samples of iLS cells differentiating into B cells. (A) Scheme of B-cell induction from iLS cells. Time-course samples were prepared at the indicated time points. (B) Flow cytometric profiles of B220 and CD19 expression. Cultured iLS cells were analyzed at the indicated time point during B-cell commitment. (C) Western blot analysis for localization of hId3-ERT2 fusion protein. α-Tubulin and Lamin A/C are shown as loading controls for cytosolic and nuclear fractions. (D) Reproducibility matrix between every pair of 16 time points from three independent experiments. (E) Principal component analysis (PCA) of the gene expression pattern of differentially expressed genes (n = 4290) in each time point. Genes were selected for their variance (more than twofold difference with q-values <0.01) using ANOVA. (F) k-means clustering of differentially expressed genes (n = 4290) among time points. Respective gene expression is shown in gray, and representative expression pattern is highlighted in red. Heat maps of each cluster are shown at the right. See also Supplemental Figure S3 for gene ontology analysis and representative genes of each cluster. A complete list of genes in each cluster is in Supplemental Table 3.
Figure 2.
Figure 2.
Transition of core TF targets during B-cell commitment in the iLS system. (A) mRNA expression profiles of Tcf3 (E2A), Ebf1, and Pax5. (B) Composition of TF (E2A, EBF1, and PAX5) targets among clusters defined in Figure 1F. The Y-axis represents the percentage of target genes of each TF, and the actual numbers of targets are also shown in bars. (C) Box plot representation for expression of TF target and non-TF target genes. The notches in the box plot indicate 95% confidence interval.
Figure 3.
Figure 3.
Proposed gene regulatory network in B-cell fate determination. (A) Strategy for the construction of a network. (B) Gene expression profiles of highly variable TFs. Three major wave factors (early, mid, and late) are indicated as green, red, and black bars at the left. See also Supplemental Table 4 for the details of the expression profile (log fold change). (C,D) Transcriptional regulatory network during B-cell commitment. A network of wave factors (C) and constant factors (D) is shown in three time phases (early, mid, and late). The color of each node represents the transcriptional activity (activation or suppression of expression of their postulated downstream target genes) at each time frame. The thickness of the edge indicates the probability of protein–protein interaction (experimental score in the STRING database).
Figure 4.
Figure 4.
Digital single-cell RNA-seq analysis of B-cell precursors in BM. (A) Cell populations used in this analysis. The detailed sorting strategy is shown in Supplemental Figure S7A. (B) t-SNE projection of LMPP, CLP, and pro-B cells. Cells were categorized by their expression characteristics using k-means clustering (k = 5). t-SNE projection without clustering is shown in Supplemental Figure S7C. Lists of differentially expressed genes of each cluster are in Supplemental Table S6. (C) Gene expression profiles of respective cell populations. Genes were clustered with the Ward method. The representative genes in each cluster are displayed at the right of the heat map. The expression level (UMI count) of B-cell-associated TFs in individual cells is at the bottom. Complete gene lists of each cluster are in Supplemental Table S7. (D) t-SNE projection with each cell colored based on their normalized expression of B-cell-associated TFs: Spi1 (PU.1), Ikzf1 (IKAROS), Tcf3 (E2A), Foxo1, Ebf1, and Pax5. The numbers indicate the frequency of expressing cells in each cluster. See Supplemental Table S8 for detailed frequency data of all other genes.
Figure 5.
Figure 5.
Sequential priming of multiple TFs in single B-cell precursors in BM. The expression level (UMI count) of each gene among TF networks (shown in Fig. 3) in the indicated populations of BM is shown.
Figure 6.
Figure 6.
Prolonged Nfil3 expression perturbs normal B-cell commitment. (A) qRT–PCR analysis of Nfil3 in HSPCs and early B-cell progenitors in BM. Values represent mean ± SD in a representative of two independent experiments. The gating strategy for each fraction is shown in Supplemental Figure S8. (B) Expression profile of Nfil3 in BM progenitors at the single-cell level. The t-SNE projection and UMI count of Nfil3 in LMPP, CLP, and pro-B cells in BM are shown. The number in the t-SNE projection indicates the percentage of expressing cells in each cluster. (C) Western blotting of Flag tag in B220+ cells in the spleens of Eμ-Nfil3 Tg and littermate control (wild-type [WT]) mice. See also Supplemental Figure S10B for a schematic of the construct. (D) Intracellular staining of Flag tag in B220+ cells in the spleens of Eμ-Nfil3 Tg and wild-type mice. (E,F) FACS profiles (E) and cell number (F) of B-cell progenitor population in wild-type and Eμ-Nfil3 Tg mice. Values represent mean ± SD in a representative of three independent experiments. (*) P < 0.05; (**) P < 0.01; (***) P < 0.001. (G) Volcano plot for a comparison of gene expression status in pro-B (top) or pre-B (bottom) cells in BM of wild-type and Eμ-Nfil3 Tg mice. The X-axis indicates the expression ratio of Eμ-Nfil3 Tg versus wild-type cells, and the Y-axis indicates the statistical significance. The expression differences and significance of selected genes (difference between Eμ-Nfil3 and wild-type is greater than twofold; P-value is <0.01) are listed in Supplemental Table S9. (H) qRT–PCR analysis of differentially expressed genes in pro-B and pre-B cells in BM of wild-type and Eμ-Nfil3 Tg mice. Values represent mean ± SD in a representative of two independent experiments. (***) P < 0.001.
Figure 7.
Figure 7.
Essential roles of epigenetic modifiers for the generation of B cells. (A) Gene expression profiles of TFs among clusters VIII and IX in the iLS system shown in Figure 1F. (B) qRT–PCR analysis of the indicated genes in HSPC and B-cell progenitor fractions in BM. The gating strategy for each fraction is shown in Supplemental Figure S9. Values represent mean ± SD in a representative of two independent experiments. (C) t-SNE projection of the indicated genes in LMPP, CLP, and pro-B cells in BM revealed by single-cell RNA-seq analysis. The numbers indicate the percentage of expressing cells in each cluster. (DF) shRNA-mediated knockdown of the indicated genes using iLS cells. Knockdown efficiency assessed by qRT–PCR (D), FACS profiles (E), and B-cell numbers (F) are shown. Values represent mean ± SD in three independent experiments. (*) P < 0.05; (**) P < 0.01 compared with control.

Comment in

References

    1. Adam RC, Yang H, Rockowitz S, Larsen SB, Nikolova M, Oristian DS, Polak L, Kadaja M, Asare A, Zheng D, et al. 2015. Pioneer factors govern super-enhancer dynamics in stem cell plasticity and lineage choice. Nature 521: 366–370. - PMC - PubMed
    1. Bannister AJ, Kouzarides T. 2005. Reversing histone methylation. Nature 436: 1103–1106. - PubMed
    1. Boller S, Grosschedl R. 2014. The regulatory network of B-cell differentiation: a focused view of early B-cell factor 1 function. Immunol Rev 261: 102–115. - PMC - PubMed
    1. Bossen C, Murre CS, Chang AN, Mansson R, Rodewald H-R, Murre C. 2015. The chromatin remodeler Brg1 activates enhancer repertoires to establish B cell identity and modulate cell growth. Nat Immunol 16: 775–784. - PMC - PubMed
    1. Ciofani M, Madar A, Galan C, Sellars M, Mace K, Pauli F, Agarwal A, Huang W, Parkurst CN, Muratet M, et al. 2012. A validated regulatory network for Th17 cell specification. Cell 151: 289–303. - PMC - PubMed

Publication types

MeSH terms