. 2018 Mar 14;38(11):2730-2744.
doi: 10.1523/JNEUROSCI.2270-17.2017. Epub 2018 Feb 9.

Large Visual Stimuli Induce Two Distinct Gamma Oscillations in Primate Visual Cortex

Affiliations

Large Visual Stimuli Induce Two Distinct Gamma Oscillations in Primate Visual Cortex

Dinavahi V P S Murty et al. J Neurosci. .

Abstract

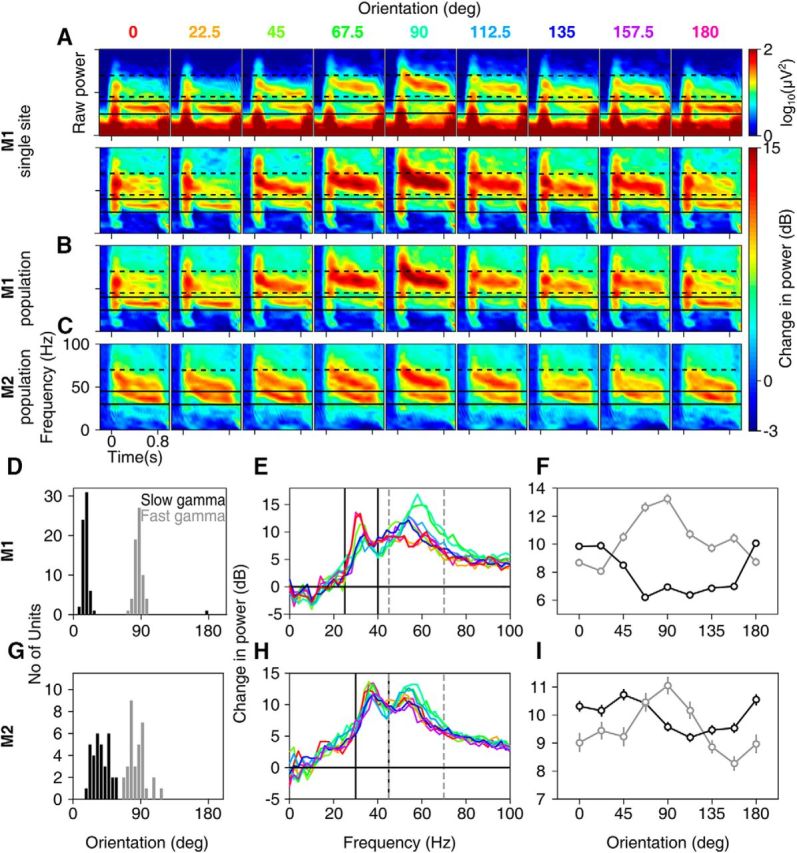
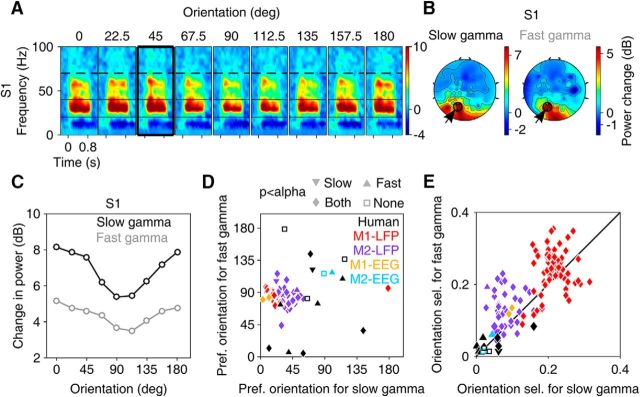
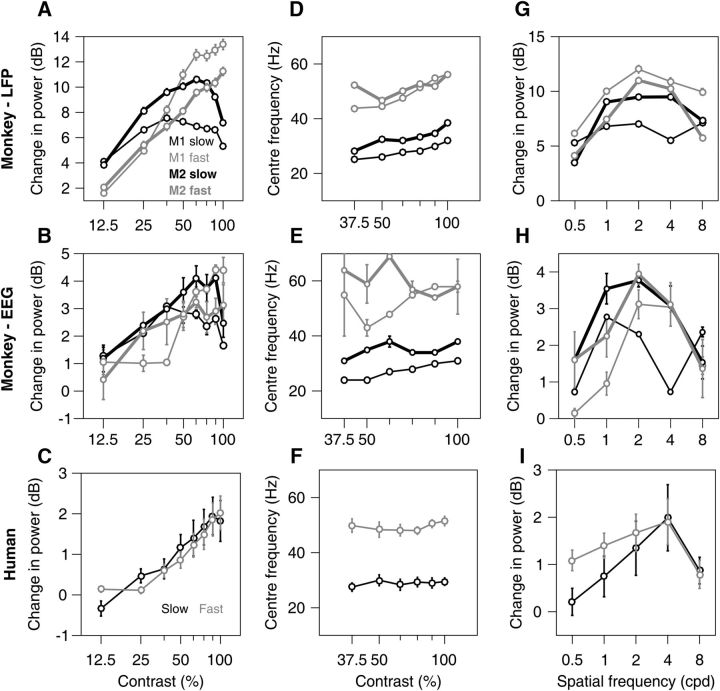
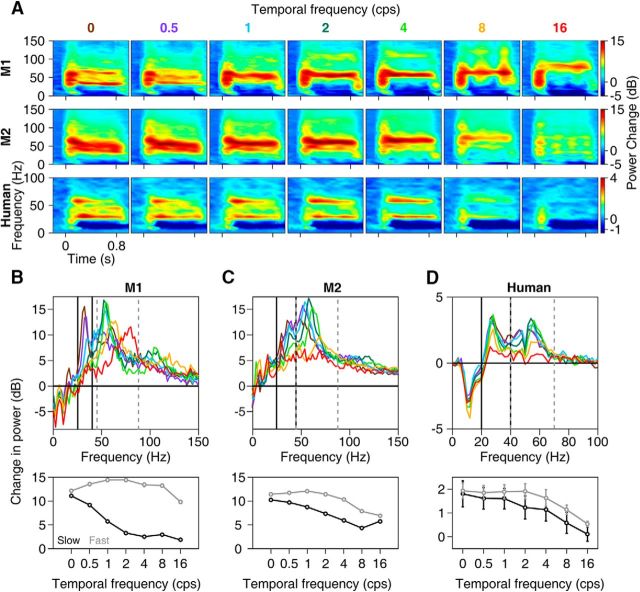
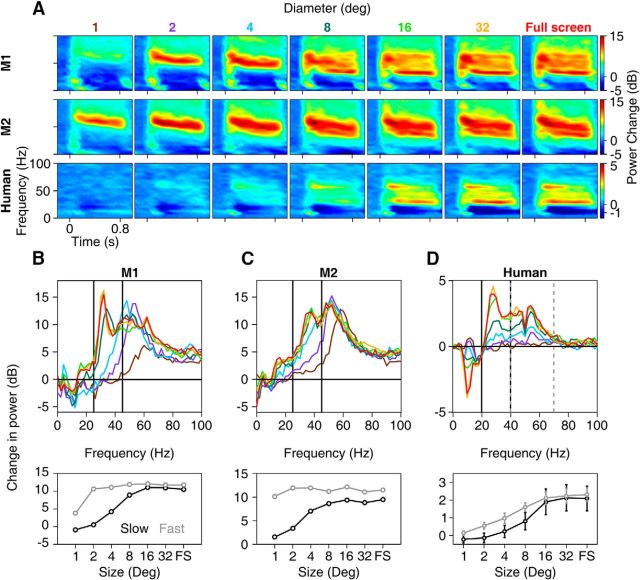
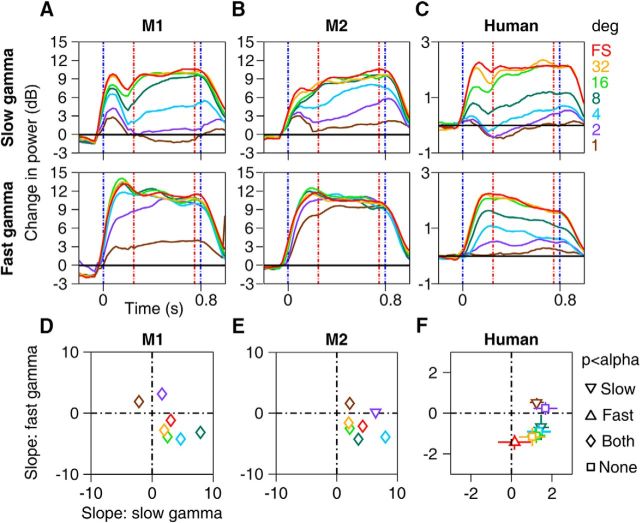
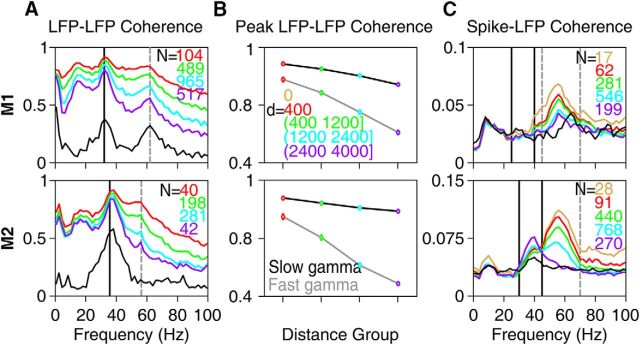
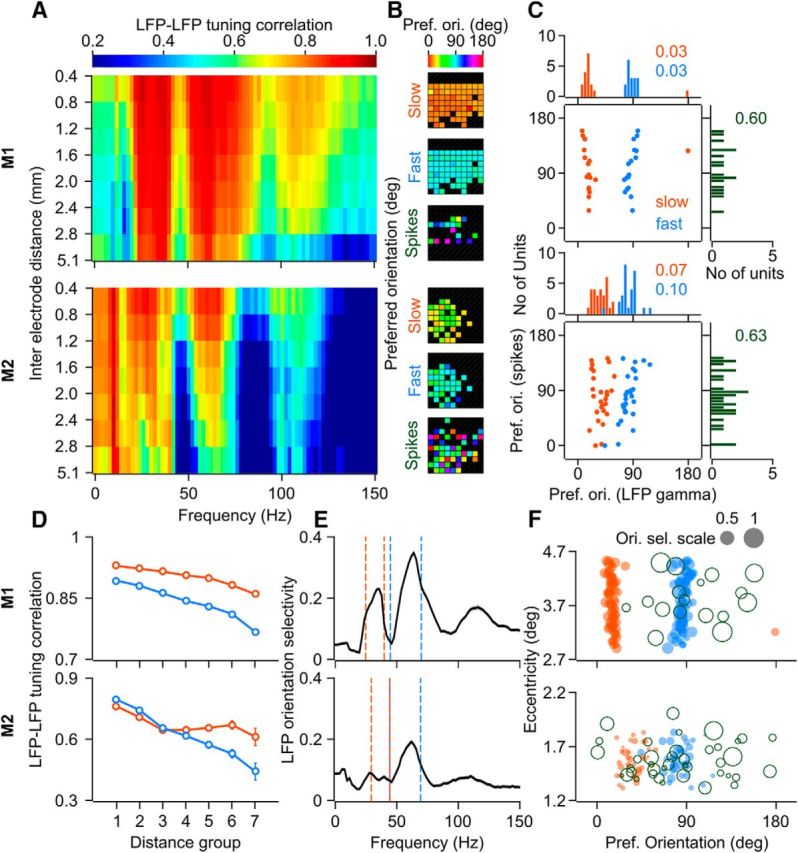
Recent studies have shown the existence of two gamma rhythms in the hippocampus subserving different functions but, to date, primate studies in primary visual cortex have reported a single gamma rhythm. Here, we show that large visual stimuli induce a slow gamma (25-45 Hz) in area V1 of two awake adult female bonnet monkeys and in the EEG of 15 human subjects (7 males and 8 females), in addition to the traditionally known fast gamma (45-70 Hz). The two rhythms had different tuning characteristics for stimulus orientation, contrast, drift speed, and size. Further, fast gamma had short latency, strongly entrained spikes and was coherent over short distances, reflecting short-range processing, whereas slow gamma appeared to reflect long-range processing. Together, two gamma rhythms can potentially provide better coding or communication mechanisms and a more comprehensive biomarker for diagnosis of mental disorders.SIGNIFICANCE STATEMENT Gamma rhythm has been associated with high-level cognitive functions such as attention and feature binding and has been reported to be abnormal in brain disorders such as autism and schizophrenia. Unlike previous studies that have shown a single gamma rhythm in the primate visual cortex, we found that large visual gratings induce two distinct gamma oscillations in both monkey LFP and human EEG. These rhythms, termed slow (25-45 Hz) and fast (45-70 Hz), exhibited distinct tuning preferences, latencies, and coherence profiles, potentially reflecting processing at two different ranges. Multiple gamma oscillations in visual cortex may provide a richer representation of external visual stimuli and could be used for developing brain-machine interfacing applications and screening tests for neuropsychiatric disorders.

Keywords: EEG; LFP; area V1; gamma; oscillation; rhythm.


Figures

Figure 1.
Figure 1.
Orientation tuning of slow and fast gamma oscillations in macaque monkeys. Time–frequency difference spectra for 9 grating orientations (labeled above the plots in degrees; stimulus is presented during 0–0.8 s) for (bottom row; the corresponding raw time–frequency power spectra are shown in the top row) an example site in Monkey 1 (A), averaged across 65 sites in Monkey 1 (B) and 34 sites in Monkey 2 (C). Solid and broken black lines show slow and fast gamma ranges. D, Histogram of orientation preference of slow and fast gamma across 65 sites in Monkey 1. E, Average change in power from baseline (−0.5 to 0 s) to the stimulus period (0.25–0.75 s) across frequencies for each orientation. F, Average change in power in the slow and fast gamma as a function of orientation. GI, Same as DF but for 34 sites in Monkey 2. For all figures, error bars indicate SEM and are smaller than the size of the symbols when not visible. Figure 1-1 shows orientation tuning in monkey EEG. Figure 1-2 shows time–frequency difference spectra and change in power spectra up to 150 Hz to depict the harmonic of fast gamma in monkey LFP.
Figure 2.
Figure 2.
Slow and fast gamma oscillations in human EEG. A, Change in time–frequency power spectrum from baseline (−0.5–0 s) for an example subject (S1). Power is averaged across three bipolar pairs in the left occipital and parietal area, shown as black dots (encircled and pointed by an arrow) in B. B, Scalp maps for slow and fast gamma ranges for stimulus orientation of 45° (highlighted with a black box in A). Similar time–frequency difference spectra and scalp maps for the rest of the subjects is shown in Figure 2-1. C, Change in power from baseline for nine orientations for S1. D, E, Preferred orientations (D) and orientation selectivity (E) for slow and fast gamma rhythms for 12 human subjects, monkey EEG (2 sites per monkey) and monkey LFP (65 and 34 sites). Different symbols in D and E indicate statistical significance for orientation selectivity (calculated from original data) compared against randomly permuted data (see “Statistical analysis” section in Materials and Methods for details) for slow and fast gamma (as indicated above D). Significance level (α) is Bonferroni corrected (from 0.05) for number of human subjects or electrodes (for monkeys). Figure 2-2 shows results for orientation tuning after data containing microsaccades are discarded from analysis.
Figure 3.
Figure 3.
Tuning for contrast and spatial frequency. A, Mean change in power for two gamma bands as a function of stimulus contrast for 65 and 36 sites for the two monkeys (top row) calculated at stimulus orientations that induced largest power change in fast gamma (90° for both monkeys) and slow gamma (0° and 45°). B, Same as A but for two EEG electrodes for each of the two monkeys. C, Mean change in power for 12 human subjects computed for a stimulus orientation that induced robust gamma in both bands (shown in a thick black box in Fig. 2A and Figure 2-1. DF, Mean peak gamma frequency in slow and fast bands. Same format as in AC. GI, Spatial frequency tuning for 65 and 34 sites in the two monkeys (G), two EEG electrodes each for the two monkeys (H), and 12 human subjects (I). Figure 3-1 shows change in power spectra for contrast and spatial frequency tuning experiments.
Figure 4.
Figure 4.
Tuning for temporal frequency. A, Change in time–frequency power spectra across seven drift speeds averaged across 65 sites in Monkey 1 (top row), 36 sites in Monkey 2 (middle row), and 12 human subjects (bottom row). For monkeys, the orientation that induced the largest slow gamma (0° and 45° for the two monkeys; Figure 4-1 shows results from orientations that induced largest fast gamma) was used. BD, Corresponding change in power across frequency (top) and total power in slow and fast gamma bands (bottom) for Monkey 1 (B), Monkey 2 (C), and humans (D).
Figure 5.
Figure 5.
Tuning for stimulus size. Same format as in Figure 4, but for size of the grating, for 65 sites in Monkey 1, 34 sites in Monkey 2, and for 12 human subjects (bottom row). Figure 5-1 shows results from orientations that induced largest fast gamma.
Figure 6.
Figure 6.
Evolution of gamma power in time. AC, Change in power spectra across time for slow (top row) and fast gamma (bottom row) averaged across 65 electrodes for Monkey 1 (A), 34 electrodes in Monkey 2 (B), and across 12 human subjects (C) computed at the preferred orientation for each gamma band. DF, Scatter plots showing regression slopes for slow versus fast gamma in the stimulus period (0.25–0.75 s, as indicated by red dashed lines in AC) for seven stimulus diameters. Error bars indicate SEM and are smaller than the size of the symbols when not visible. Different symbols indicate whether the mean slopes were significantly different from zero (p < 0.05, t test, Bonferroni corrected for the number of sizes) for slow and fast gamma (as indicated in the extreme right).
Figure 7.
Figure 7.
Field–field and spike–field coherence. A, LFP–LFP phase coherence spectra for different interelectrode distances for Monkeys 1 (top row) and 2 (bottom row). Interelectrode distance ranges (d, in μm) are shown in B. The number of pairs (N) for each group is indicated on the top right corner. LFP–LFP phase coherence when both are taken from the same electrode (i.e., interelectrode distance of zero) is trivially 1 at all frequencies and is therefore omitted. Mean LFP–EEG phase coherence is shown in black. B, Average LFP–LFP phase coherence at the peak slow (32 and 36 Hz for the two monkeys) and fast gamma bands (62 and 56 Hz) as a function of interelectrode distance. C, Mean spike–LFP coherence for spike–LFP pairs separated by different interelectrode distances. Mean spike-EEG coherence is shown in black.
Figure 8.
Figure 8.
LFP and spikes orientation tuning properties across the sites. A, Mean LFP–LFP orientation tuning correlation (Spearman's rank correlation coefficient) spectra for different interelectrode distances (seven groups; distance delimiters for each group are indicated on the y-axis, in mm) for Monkey 1 (top row) and Monkey 2 (bottom row). Total number of pairs, N = 2080 for Monkey 1 and N = 561 for Monkey 2 (groupwise numbers are provided in the Materials and Methods section). B, Preferred orientation for slow gamma, fast gamma, and spiking response across the microelectrode array for the two monkeys. C, Scatter of preferred orientation for slow (orange) and fast (blue) gamma versus that for the spiking response and the corresponding marginal histograms. Circular variance of the distribution of preferred orientations is mentioned in the corresponding color. N = 17 for Monkey 1, 28 for Monkey 2. D, Mean LFP–LFP orientation tuning correlation in the slow and fast gamma bands as a function of interelectrode distance. E, Mean orientation selectivity of LFP power (N = 65 and 34 for Monkeys 1 and 2, respectively) at different frequencies; Dashed color lines indicate the limits for slow and fast gamma bands. Gray shaded regions (barely visible) denote SEM. F, Scatter of eccentricity (in degrees of visual angle) of the receptive field center of sites and the preferred orientation for the corresponding slow gamma, fast gamma, and spikes (open circles). Size of the circle denotes orientation selectivity (gray circles with the corresponding value of selectivity are shown as a reference for the scale).

References

    1. Adesnik H, Bruns W, Taniguchi H, Huang ZJ, Scanziani M (2012) A neural circuit for spatial summation in visual cortex. Nature 490:226–231. 10.1038/nature11526 - DOI - PMC - PubMed
    1. Bartos M, Vida I, Jonas P (2007) Synaptic mechanisms of synchronized gamma oscillations in inhibitory interneuron networks. Nat Rev Neurosci 8:45–56. 10.1038/nrn2044 - DOI - PubMed
    1. Bastos AM, Vezoli J, Bosman CA, Schoffelen JM, Oostenveld R, Dowdall JR, De Weerd P, Kennedy H, Fries P (2015) Visual areas exert feedforward and feedback influences through distinct frequency channels. Neuron 85:390–401. 10.1016/j.neuron.2014.12.018 - DOI - PubMed
    1. Belluscio MA, Mizuseki K, Schmidt R, Kempter R, Buzsáki G (2012) Cross-frequency phase-phase coupling between θ and γ oscillations in the hippocampus. J Neurosci 32:423–435. 10.1523/JNEUROSCI.4122-11.2012 - DOI - PMC - PubMed
    1. Berens P. (2009) CircStat: A MATLAB toolbox for circular statistics. Journal of Statistical Software. Available at: https://www.jstatsoft.org/article/view/v031i10. Accessed 5 November 2017.

Publication types

LinkOut - more resources