. 2018 Feb 27;115(9):E2068-E2076.
doi: 10.1073/pnas.1716266115. Epub 2018 Feb 12.

Chimeric antigen receptor T cells form nonclassical and potent immune synapses driving rapid cytotoxicity

Affiliations

Chimeric antigen receptor T cells form nonclassical and potent immune synapses driving rapid cytotoxicity

A J Davenport et al. Proc Natl Acad Sci U S A. .

Erratum in

Abstract

Chimeric antigen receptor T (CAR-T) cells are effective serial killers with a faster off-rate from dying tumor cells than CAR-T cells binding target cells through their T cell receptor (TCR). Here we explored the functional consequences of CAR-mediated signaling using a dual-specific CAR-T cell, where the same cell was triggered via TCR (tcrCTL) or CAR (carCTL). The carCTL immune synapse lacked distinct LFA-1 adhesion rings and was less reliant on LFA to form stable conjugates with target cells. carCTL receptors associated with the synapse were found to be disrupted and formed a convoluted multifocal pattern of Lck microclusters. Both proximal and distal receptor signaling pathways were induced more rapidly and subsequently decreased more rapidly in carCTL than in tcrCTL. The functional consequence of this rapid signaling in carCTL cells included faster lytic granule recruitment to the immune synapse, correlating with faster detachment of the CTL from the target cell. This study provides a mechanism for how CAR-T cells can debulk large tumor burden quickly and may contribute to further refinement of CAR design for enhancing the quality of signaling and programming of the T cell.

Keywords: cell death; chimeric antigen receptor; cytotoxic T lymphocyte; cytotoxicity; immune synapse.


Conflict of interest statement

The authors declare no conflict of interest.

Figures
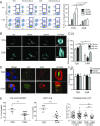
Fig. 1.
Fig. 1.
carCTL synapses are smaller and lack a defined Lck patch. (A) Flow cytometry plots (A, Left) of CTV-labeled effector CAR.OTI CTLs cocultured with EL4 target cells and EL4HER2 (CAR) or EL4OVA257 (TCR) each labeled with CTFRhi or parental EL4 (CTFRlo). This conjugate assay was also performed in the absence or presence of LFA-1 blocking antibody. Cells forming conjugates were analyzed over 40 min. The graph (A, Right) shows percentage of CD8+ T cells forming conjugates with targets (mean ± SD) where each condition was performed in triplicate. The figure shows pooled data from four independent experiments. *P < 0.05 as determined by a Student’s t test. (B) Confocal microscopy of CAR.OTI cells in conjugation with MC57 target cells via TCR or CAR, labeled with anti-LFA-1. Montage of confocal planes are shown across the top, middle, and bottom of the T cell. (C, i) Conjugate assay showing the percentage of synapses dependent on LFA-1 binding relative to normal kinetics. CTV-labeled CAR.OTI CTLs were incubated with CTFR-labeled EL4-OVA257 (TCR) or EL4-Her2 (CAR) before being analyzed by flow cytometry. CD8+ T cells (CTV) still in synapse with target (CTVhi/CTFRhi) are compared with proportion of cells in synapse in the presence of LFA-1 blocking antibody and shown is the proportion of total synapses which are lost when LFA-1 is blocked. Data are an average of three independent experiments, pooled, showing mean ± SEM and statistical differences between TCR and CAR at each time point determined by Student’s t test, *P < 0.05. (C, ii) Chromium release killing assay. Activated CAR.OTI cells were incubated with 51Cr-labeled MC57-OVA (TCR) or MC57-HER2 (CAR) cells, in the presence of media alone (Untreated, white), isotype control antibody (Isotype, black), or anti-CD11a blocking antibody (LFA Block, Gray) for 5 h at 1:10 E:T ratio, before measuring 51Cr-release. Data represent the percentage of tumor cell lysis (mean ± SD) from two independent experiments. (D) Confocal microscopy of CAR.OTI cells in conjugation with MC57 target cells via TCR or CAR, labeled with anti-Lck (green), anti-actin (red), and Hoechst (blue). (E) ISs as shown in D were blindly quantitated using an unbiased approach for the percentage of conjugates displaying a complete discrete Lck patch at the IS, a cleared actin ring, and the size of the actin ring in conjugates after 5 or 20 min of conjugation. Each data point represents a field of view (n > 6) with at least 8–10 conjugates from each (therefore >48 cells), from more than three biological replicate experiments. Student’s t test showed statistical differences *P < 0.05, **P < 0.01, ***P < 0.001 as indicated.
Fig. 2.
Fig. 2.
CAR ligation initiates faster proximal and distal T cell signaling than TCR ligation. CAR.OTI CTLs cocultured with parental, OVA257-, or HER2-expressing MC57 targets and Western blotting performed for (A) pLck; (B) pErk, total Erk; and actin. Quantitation utilized Fiji imaging software and was normalized to actin loading. Data represented in graphs as mean fold change from parental expression. Western blots are representative of two (A) and three (B) experiments. FD, fold difference. (C) Effector CAR.OTI CTLs were labeled with Fluo4-AM and added to adherent MC57 cells expressing either the TCR antigen (OVA257) or the CAR antigen (HER2) and imaged using live-cell microscopy. Individual conjugates were quantitated for the time taken after T cell calcium flux until PI entering the target cell cytosol and the fold change in Ca2+ intensity, as measured by Fluo-4-AM MFI. Each point represents one conjugate and data pooled from three independent experiments. Student’s t test, ***P < 0.001. (D) CAR.OTI CTLs were added to plates precoated with either PBS (UT), isotype control (Iso), anti-CD3, anti-CD3 + anti-CD28, or anti-myc-tag (CAR). Supernatant was collected after 5 h and analyzed for IFN-γ and TNF levels. Cytokine expression levels (mean ± SEM) in picograms per milliliter of three independent pooled experiments are shown. Statistical significance was determined using Student’s t test between groups, *P < 0.05.
Fig. 3.
Fig. 3.
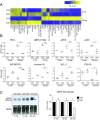
Proximal signaling dissipates more quickly in carCTL than in tcrCTL. (A) RPPA analysis of CAR.OTI CTL signaling at 2 min and 30 min after plate-bound TCR or CAR stimulation. The 43 proteins included in the heat map all have statistically significant changes at 30 min. Blue and yellow represent down- and up-regulation, respectively. Relative protein levels (Z-scores) are shown in the heat map, color-coded according to the legend. Columns are scaled to have a mean of 0 and an SD of 1. (B) Quantitated graphical analysis from A of select proteins involved in T cell signaling, cell survival, or membrane trafficking. (C) Western blot validation of pErk expression from B. Western blot analysis probing for pErk at 2 min, 10 min, and 30 min of CAR.OTI stimulation with solid-phase anti-CD3 (TCR) or anti-tag (CAR). The pERK level was normalized to total amount of protein and represented as fold difference to TCR expression at each time point. Student’s t test, *P < 0.05.
Fig. 4.
Fig. 4.
CAR ligation results in faster granule recruitment to the IS. Effector CAR.OTI CTLs were labeled with Fluo4-AM and lysotracker red, added to adherent MC57 cells expressing either the TCR antigen (OVA257) or the CAR antigen (HER2), and imaged using live-cell microscopy. (A) Representative montage of a carCTL conjugate polarizing granules toward the IS. White arrow highlights granules. Time in minutes:seconds. (Scale bar: 10 μm.) (B) Individual conjugates were quantitated for the time taken after calcium flux for granule mass to be recruited to the IS, the velocity of the granule mass, and the time from granule recruitment to CTL detachment. Each point represents one conjugate and data pooled from three independent experiments. Student’s t test ,**P < 0.001, *P < 0.01. See Movie S2.
Fig. 5.
Fig. 5.
Schematic model of the CAR and TCR IS and temporal killing event differences. Schematic of the IS in CTLs when activated via the CAR or TCR. (A) TCR-mediated conjugates display a classical bull’s-eye structure with well-characterized SMAC domains; however, signaling via CAR (B) results in disorganized Lck patterns and lack of a pSMAC domain, as labeled by LFA-1 with a smaller actin clearance. (C) Timeline depicting temporal differences in killing events by CAR.OTI CTLs when activated by the TCR or CAR.

References

    1. Park JH, Geyer MB, Brentjens RJ. CD19-targeted CAR T-cell therapeutics for hematologic malignancies: Interpreting clinical outcomes to date. Blood. 2016;127:3312–3320. - PMC - PubMed
    1. Porter DL, et al. Chimeric antigen receptor T cells persist and induce sustained remissions in relapsed refractory chronic lymphocytic leukemia. Sci Transl Med. 2015;7:303ra139. - PMC - PubMed
    1. Turtle CJ, et al. CD19 CAR-T cells of defined CD4+:CD8+ composition in adult B cell ALL patients. J Clin Invest. 2016;126:2123–2138. - PMC - PubMed
    1. Lee DW, et al. T cells expressing CD19 chimeric antigen receptors for acute lymphoblastic leukaemia in children and young adults: A phase 1 dose-escalation trial. Lancet. 2015;385:517–528. - PMC - PubMed
    1. Brown CE, et al. Regression of glioblastoma after chimeric antigen receptor T-cell therapy. N Engl J Med. 2016;375:2561–2569. - PMC - PubMed

Publication types