. 2018 Feb 27;115(9):E2105-E2114.
doi: 10.1073/pnas.1720985115. Epub 2018 Feb 12.

Ridding fMRI data of motion-related influences: Removal of signals with distinct spatial and physical bases in multiecho data

Affiliations

Ridding fMRI data of motion-related influences: Removal of signals with distinct spatial and physical bases in multiecho data

Jonathan D Power et al. Proc Natl Acad Sci U S A. .

Abstract

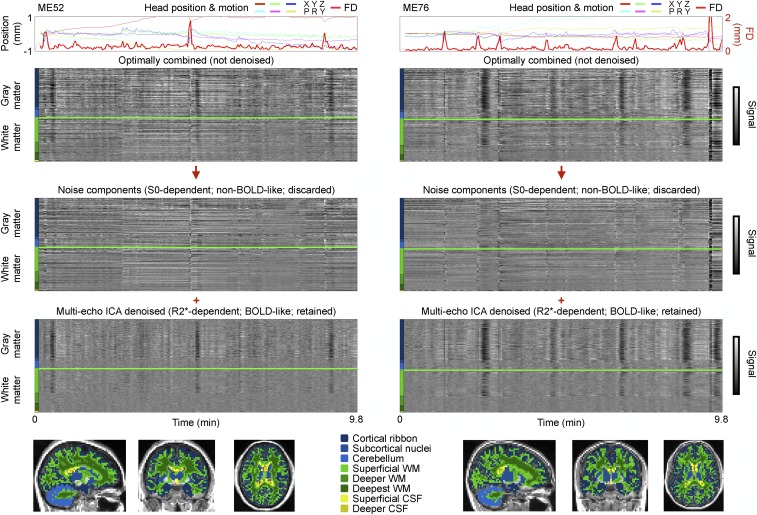
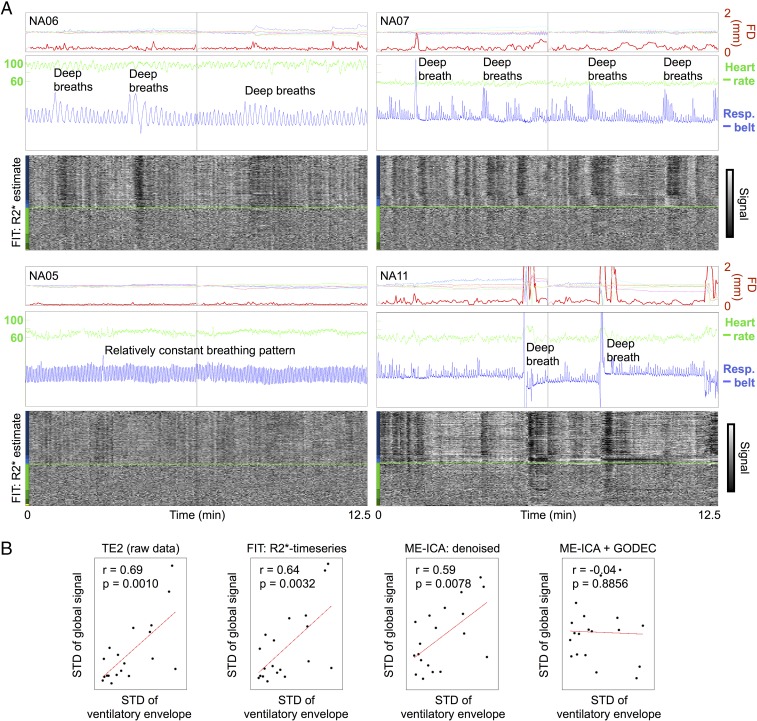
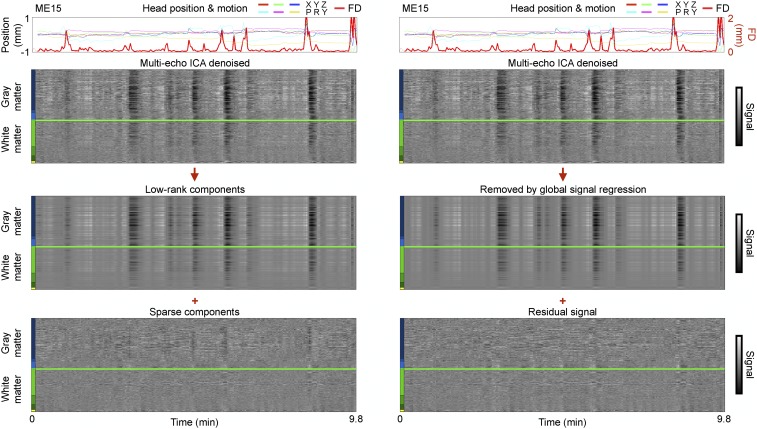
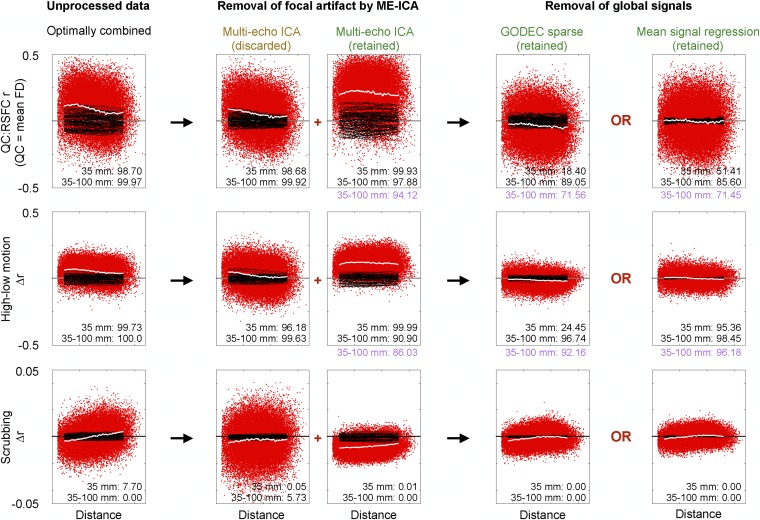
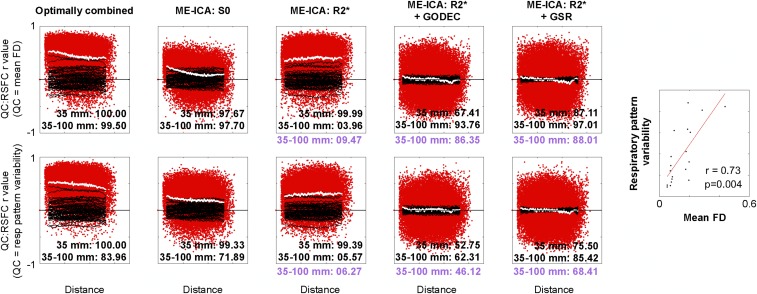
"Functional connectivity" techniques are commonplace tools for studying brain organization. A critical element of these analyses is to distinguish variance due to neurobiological signals from variance due to nonneurobiological signals. Multiecho fMRI techniques are a promising means for making such distinctions based on signal decay properties. Here, we report that multiecho fMRI techniques enable excellent removal of certain kinds of artifactual variance, namely, spatially focal artifacts due to motion. By removing these artifacts, multiecho techniques reveal frequent, large-amplitude blood oxygen level-dependent (BOLD) signal changes present across all gray matter that are also linked to motion. These whole-brain BOLD signals could reflect widespread neural processes or other processes, such as alterations in blood partial pressure of carbon dioxide (pCO2) due to ventilation changes. By acquiring multiecho data while monitoring breathing, we demonstrate that whole-brain BOLD signals in the resting state are often caused by changes in breathing that co-occur with head motion. These widespread respiratory fMRI signals cannot be isolated from neurobiological signals by multiecho techniques because they occur via the same BOLD mechanism. Respiratory signals must therefore be removed by some other technique to isolate neurobiological covariance in fMRI time series. Several methods for removing global artifacts are demonstrated and compared, and were found to yield fMRI time series essentially free of motion-related influences. These results identify two kinds of motion-associated fMRI variance, with different physical mechanisms and spatial profiles, each of which strongly and differentially influences functional connectivity patterns. Distance-dependent patterns in covariance are nearly entirely attributable to non-BOLD artifacts.

Trial registration: ClinicalTrials.gov NCT01031407.

Keywords: fMRI; functional connectivity; motion artifact; multiecho; respiration.


Conflict of interest statement

The authors declare no conflict of interest.

Figures

Fig. 1.
Fig. 1.
ME-ICA denoising separates non–BOLD-like signals from BOLD-like signals. (Top) ME-ICA results for two ME subjects are shown. (Bottom) Colored masks denote FreeSurfer-derived brain compartments used to organize the voxels in heat maps (colored bars). CSF, cerebrospinal fluid; WM, white matter.
Fig. 2.
Fig. 2.
Global BOLD signal changes often reflect respiratory patterns. (A) Motion and physiological traces are shown for four NA subjects, as are FIT R2* time series, following conventions of earlier figures. The blue trace is the raw respiratory belt trace, and the green trace is the heart rate derived from peaks in the pulse oximeter trace. Resp., Respiratory. (B) Correlation between variance in respiratory traces and variance in global fMRI signals, shown for the raw fMRI data at TE2, for FIT R2* time series, for ME-ICA denoised time series, and for ME-ICA + GODEC time series. Each point is a scan. Respiratory variance (x axis) is defined as the SD of the envelope of the normalized respiratory belt waveform.
Fig. 3.
Fig. 3.
Low-rank signals are similar to global signals. For an ME scan shown in Fig. 1, ME-ICA denoised data are shown undergoing GODEC and global signal regression.
Fig. 4.
Fig. 4.
Spatial interpretation of denoising steps in ME data. Distance-dependent motion-related artifact is assayed with three kinds of analyses at several stages of denoising (columns): QC:RSFC analyses (Top), differences in correlations between high- and low-motion subjects (Middle), and scrubbing analyses (Bottom). The red points and the white smoothing curve display actual data, and the black smoothing curves depict 50 of the 10,000 conducted permutations of mean FD (Top and Middle) or censored volumes (Bottom). The inset numbers are the percentiles of observed data among permutations, in terms of smoothing curves at 35 mm (to index all motion-related signals) and the difference between smoothing curves at 35 and 100 mm (to index distance dependence). Purple permutation ranks are drawn from SI Appendix, Fig. S10 and reflect smoothing curve values after censoring volumes with FD > 0.2 mm. Nuisance regression in the plot at the far right contains a single regressor: the mean cortical signal. (Top) RMS values of the plots (from left to right) are 0.16, 0.13, 0.25, 0.13, and 0.13. (Middle) RMS values of the plots (from left to right) are 0.08, 0.09, 0.13, 0.05, and 0.04. (Top) Mean values are 0.09, 0.05, 0.21, −0.03, and 0.00. (Middle) Mean values are 0.05, 0.02, 0.11, −0.01, and 0.00. Slopes of linear fits to the QC:RSFC curves in optimally combined and ME-ICA denoised data are −0.009 and −0.002, and corresponding fits to the high–low data are −0.005 and −0.001. Δr, change in correlation.
Fig. 5.
Fig. 5.
Replication in NA data of two kinds of motion-associated signals with different spatial profiles and distinct physical bases. QC:RSFC plots are formed for NA data as they were for the ME data in Fig. 4. Both S0 and R2* variance is contingent on subject motion but with different spatial patterns. Two kinds of QC:RSFC plot are shown for the NA subjects: using mean FD as the QC measure (Top; as in Fig. 4) and variability in the standardized respiratory (resp) belt envelope as the QC measure (Bottom; the same measure used in Fig. 2B). The plots show similar phenomena because, as the plot at the far right shows, mean motion and respiratory pattern variability are highly correlated. Purple values reflect permutation ranks after motion censoring as in Fig. 4.

Comment in

References

    1. Buckner RL, Krienen FM, Yeo BT. Opportunities and limitations of intrinsic functional connectivity MRI. Nat Neurosci. 2013;16:832–837. - PubMed
    1. Power JD, Schlaggar BL, Petersen SE. Studying brain organization via spontaneous fMRI signal. Neuron. 2014;84:681–696. - PMC - PubMed
    1. Murphy K, Birn RM, Bandettini PA. Resting-state fMRI confounds and cleanup. Neuroimage. 2013;80:349–359. - PMC - PubMed
    1. Bianciardi M, et al. Sources of functional magnetic resonance imaging signal fluctuations in the human brain at rest: A 7 T study. Magn Reson Imaging. 2009;27:1019–1029. - PMC - PubMed
    1. Marcus DS, et al. WU-Minn HCP Consortium Human connectome project informatics: Quality control, database services, and data visualization. Neuroimage. 2013;80:202–219. - PMC - PubMed

Publication types

Associated data