

National trends in drinking water quality violations
- PMID: 29440421
- PMCID: PMC5834717
- DOI: 10.1073/pnas.1719805115
National trends in drinking water quality violations
Abstract
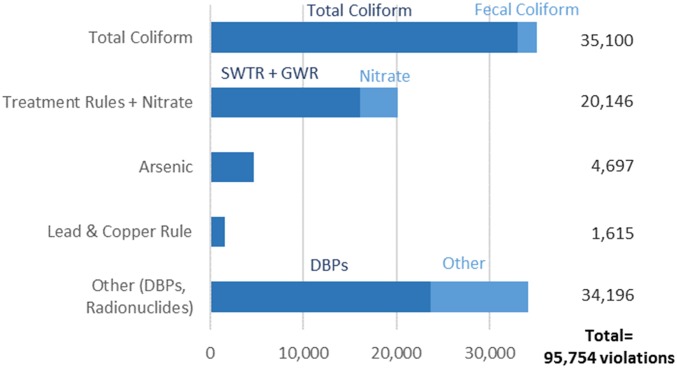
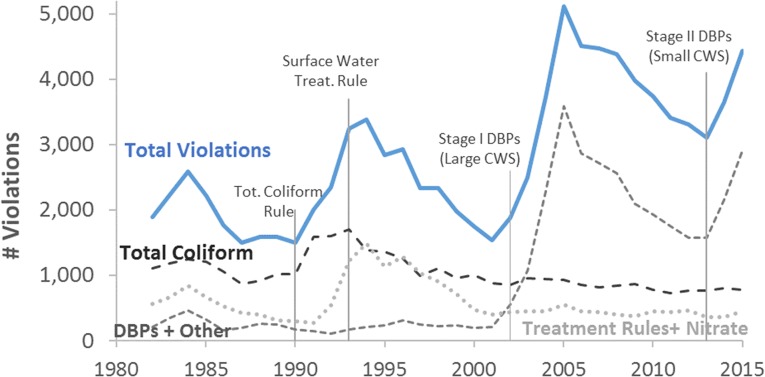
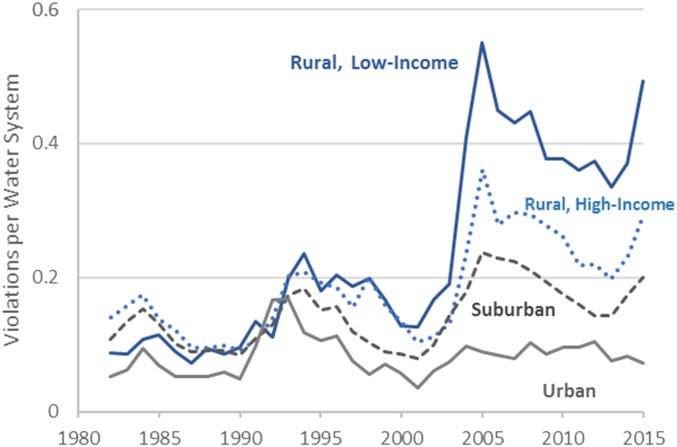
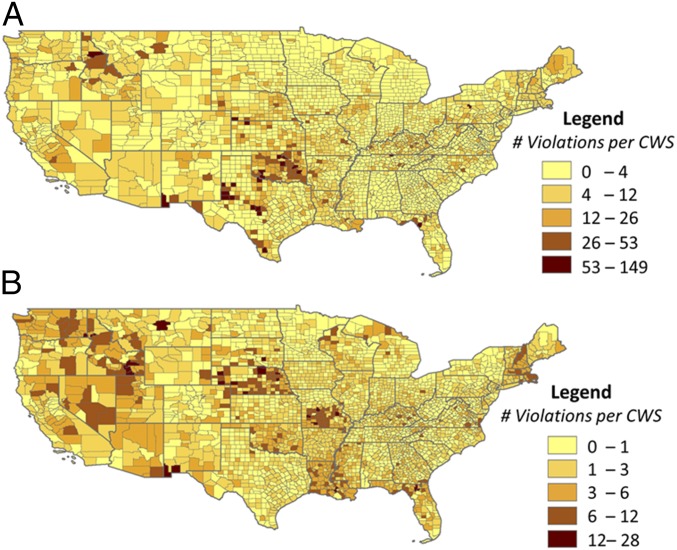
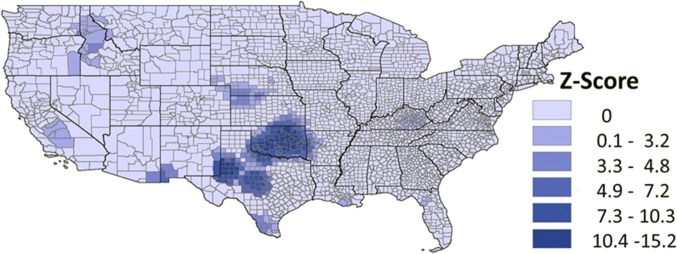
Ensuring safe water supply for communities across the United States is a growing challenge in the face of aging infrastructure, impaired source water, and strained community finances. In the aftermath of the Flint lead crisis, there is an urgent need to assess the current state of US drinking water. However, no nationwide assessment has yet been conducted on trends in drinking water quality violations across several decades. Efforts to reduce violations are of national concern given that, in 2015, nearly 21 million people relied on community water systems that violated health-based quality standards. In this paper, we evaluate spatial and temporal patterns in health-related violations of the Safe Drinking Water Act using a panel dataset of 17,900 community water systems over the period 1982-2015. We also identify vulnerability factors of communities and water systems through probit regression. Increasing time trends and violation hot spots are detected in several states, particularly in the Southwest region. Repeat violations are prevalent in locations of violation hot spots, indicating that water systems in these regions struggle with recurring issues. In terms of vulnerability factors, we find that violation incidence in rural areas is substantially higher than in urbanized areas. Meanwhile, private ownership and purchased water source are associated with compliance. These findings indicate the types of underperforming systems that might benefit from assistance in achieving consistent compliance. We discuss why certain violations might be clustered in some regions and strategies for improving national drinking water quality.
Keywords: Safe Drinking Water Act; drinking water; regulatory compliance; violations; water quality.
Conflict of interest statement
The authors declare no conflict of interest.
Figures
References
-
- Messner M, et al. An approach for developing a national estimate of waterborne disease due to drinking water and a national estimate model application. J Water Health. 2006;4:201–240. - PubMed
-
- US Environmental Protection Agency 2009. Factoids: Drinking water and ground water statistics for 2009 (US Environmental Protection Agency, Washington, DC), EPA-816-K-09-004. - PubMed
-
- Rahman T, Kohli M, Megdal S, Aradhyula S, Moxley J. Determinants of environmental noncompliance by public water systems. Contemp Econ Policy. 2010;28:264–274.
Publication types
MeSH terms
Substances
LinkOut - more resources
Full Text Sources
Other Literature Sources
