. 2018 Feb 27;115(9):2156-2161.
doi: 10.1073/pnas.1710352115. Epub 2018 Feb 13.

Generic assembly patterns in complex ecological communities

Affiliations

Generic assembly patterns in complex ecological communities

Matthieu Barbier et al. Proc Natl Acad Sci U S A. .

Abstract

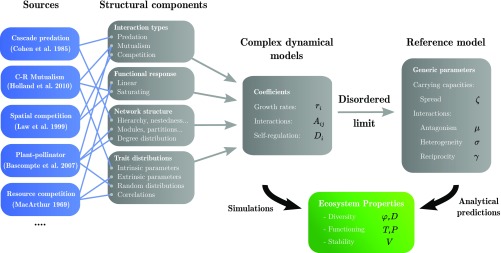
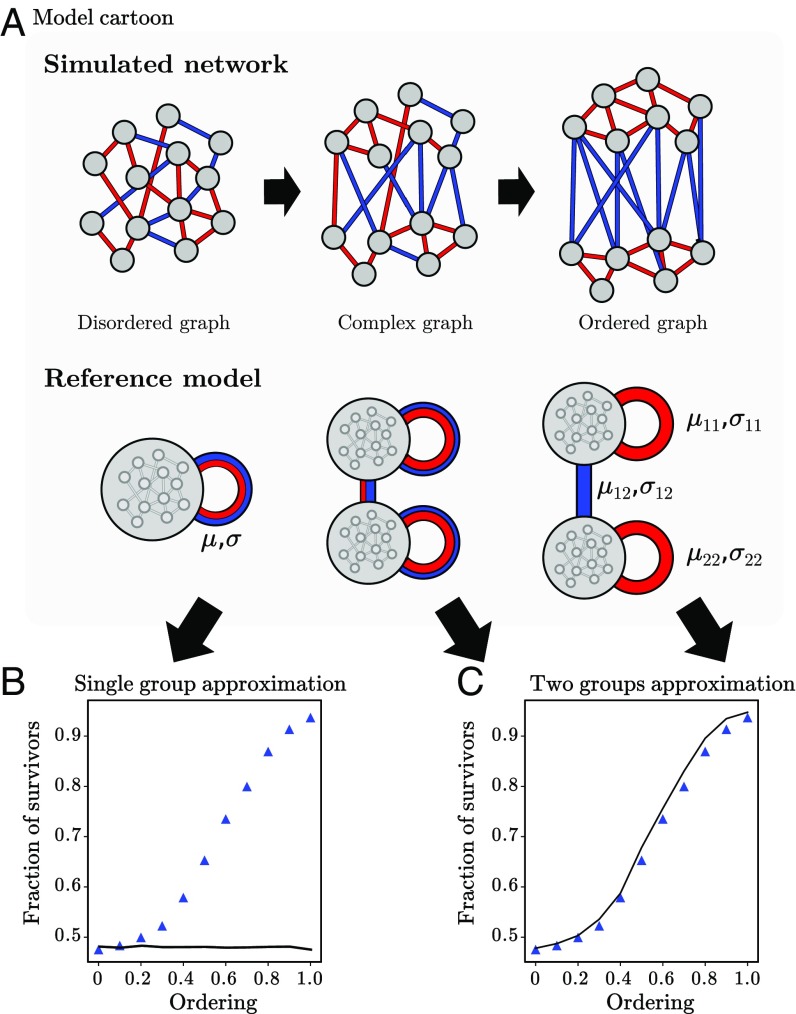
The study of ecological communities often involves detailed simulations of complex networks. However, our empirical knowledge of these networks is typically incomplete and the space of simulation models and parameters is vast, leaving room for uncertainty in theoretical predictions. Here we show that a large fraction of this space of possibilities exhibits generic behaviors that are robust to modeling choices. We consider a wide array of model features, including interaction types and community structures, known to generate different dynamics for a few species. We combine these features in large simulated communities, and show that equilibrium diversity, functioning, and stability can be predicted analytically using a random model parameterized by a few statistical properties of the community. We give an ecological interpretation of this "disordered" limit where structure fails to emerge from complexity. We also demonstrate that some well-studied interaction patterns remain relevant in large ecosystems, but their impact can be encapsulated in a minimal number of additional parameters. Our approach provides a powerful framework for predicting the outcomes of ecosystem assembly and quantifying the added value of more detailed models and measurements.

Keywords: community assembly; disordered systems; theoretical ecology.


Conflict of interest statement

The authors declare no conflict of interest.

Figures

Fig. 1.
Fig. 1.
General outline of our approach. On the left are listed examples of sources from the literature (–22), from which model features have been extracted (see full list in SI Appendix, Numerical Experiments). Diverse combinations of these model features and variations of their parameters yield distinct communities, characterized by the coefficients and functional response in the dynamics Eq. 1. We simulate them until they reach an assembled equilibrium, whose properties we measure. We then randomize interactions and carrying capacities, preserving the four statistics in Eq. 3. The randomized community’s equilibrium properties are known analytically from the solution of the reference model (6) and can be compared with simulation outcomes; see Fig. 2.
Fig. 2.
Fig. 2.
Simulation results for the resource competition model (dots) and analytical predictions in the disordered limit (lines) for various community properties: (A) total biomass T, (B) fraction of surviving species ϕ, (C) Simpson diversity D, and (D) temporal variability V. We vary the number of resources R and the heterogeneity of consumption rates σξ (see Materials and Methods). This then affects the value of the generic parameters in Eq. 3, inserted into the analytical solution of the reference model to obtain null predictions. The remarkable agreement confirms that the resource competition model exhibits fully disordered behavior.
Fig. 3.
Fig. 3.
Different models visit the generic parameter space (μ,σ,γ,ζ) defined in Eq. 3 as we vary their model-specific control parameters (bold arrows, defined in Materials and Methods). We illustrate, in the (μ,σ) and (γ,ζ) planes, the regions visited by two models. In orange is predation with mean intensity β[0.1,25] and conversion efficiency ε[0,1] (in this model, ζ is a free parameter). In blue is resource competition with resources number R[102,104] and consumption heterogeneity σξ[0.1,0.6]. (Inset) An example where a competitive community and a predator–prey community display identical species abundance distributions, well predicted by the theory (solid line), corresponding to the parameter values marked by the cross. We explain, in Discussion and in SI Appendix, Reference Model and Community Properties, under which conditions these distributions are predicted to be narrow (e.g., normal) or fat-tailed (e.g., lognormal); see also refs. and .
Fig. 4.
Fig. 4.
Network structure and deviation from the disordered limit. For the three main interaction types—(A) competition, (B) predation, and (C) mutualism—we show the relative error (y axis, between 0% and 50%) of the reference model predictions against simulations; see Eq. 7. (Insets) Same results in log scale. The symbol sets correspond to different network structural properties: assortativity, partitioning, clustering, nestedness, and scale-free or cascade structure. Each comes with a specific control parameter (x axis; see list in SI Appendix, Numerical Experiments), allowing transition from an Erdos–Renyi random graph to a maximally structured network. For instance, the probability pd of attaching preferentially to nodes with higher degree yields a scale-free network when pd=1. We also vary connectance in a random graph. We see that only bipartition, cascade structure, and nestedness cause deviations from null predictions in competitive and predatory interactions, and none do so in mutualistic communities (where interaction strength is limited; see Materials and Methods).
Fig. 5.
Fig. 5.
Genericity beyond full disorder. We give an example of structure: two functional groups with competitive and mutualistic interactions. (A) Cartoon of the model. In the ordered limit, all intragroup interactions are competitive and all intergroup interactions are mutualistic. The ordering parameter is the probability to rewire interactions without respecting group structure. (B) Fraction of surviving species in the assembled community for the simulation model (symbols) against analytical predictions in the disordered limit (solid line) which cannot account for ordering. (C) Same data, but the reference model is extended with more structure, distinguishing between parameters for intergroup and intragroup interactions. It successfully predicts community properties for any degree of ordering, even the complex intermediate case where group boundaries are blurred.

References

    1. Loreau M. From Populations to Ecosystems: Theoretical Foundations for a New Ecological Synthesis (MPB-46) Princeton Univ Press; Princeton: 2010.
    1. Holt RD. Community modules in multitrophic interactions in terrestrial ecosystems, 36th Symposium of the British Ecological Society. Blackwell Sci; Oxford: 1997. pp. 333–349.
    1. Bascompte J, Stouffer DB. The assembly and disassembly of ecological networks. Philos Trans R Soc Lond B Biol Sci. 2009;364:1781–1787. - PMC - PubMed
    1. Levins R. Discussion paper: The qualitative analysis of partially specified systems. Ann New York Acad Sci. 1974;231:123–138. - PubMed
    1. Brose U, Williams RJ, Martinez ND. Allometric scaling enhances stability in complex food webs. Ecol Lett. 2006;9:1228–1236. - PubMed

Publication types