. 2018 Mar 7;38(10):2454-2470.
doi: 10.1523/JNEUROSCI.2496-17.2018. Epub 2018 Feb 12.

Altered Signaling in the Descending Pain-modulatory System after Short-Term Infusion of the μ-Opioid Agonist Remifentanil

Affiliations

Altered Signaling in the Descending Pain-modulatory System after Short-Term Infusion of the μ-Opioid Agonist Remifentanil

Christian Sprenger et al. J Neurosci. .

Abstract

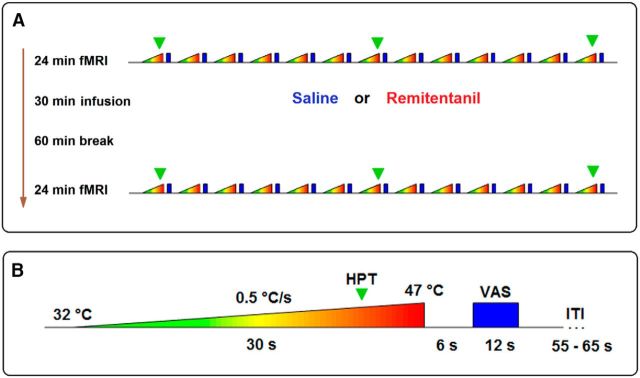
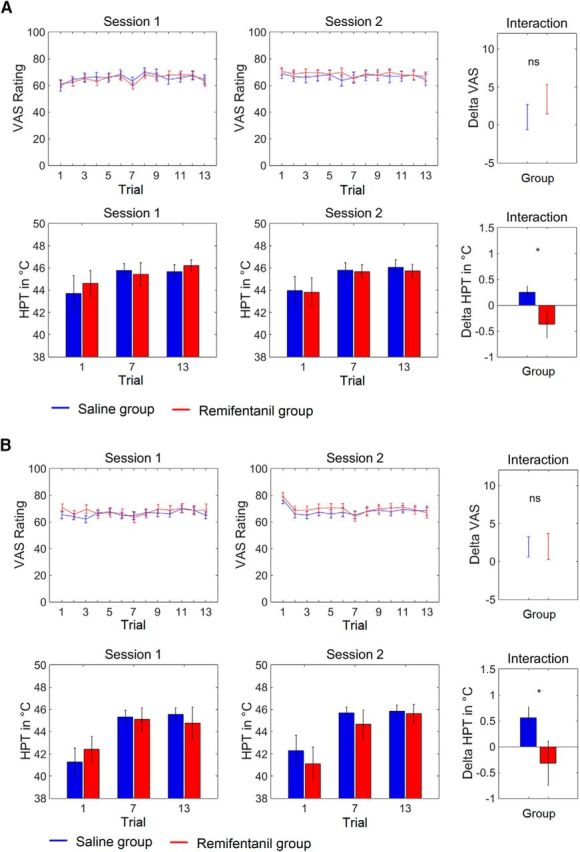
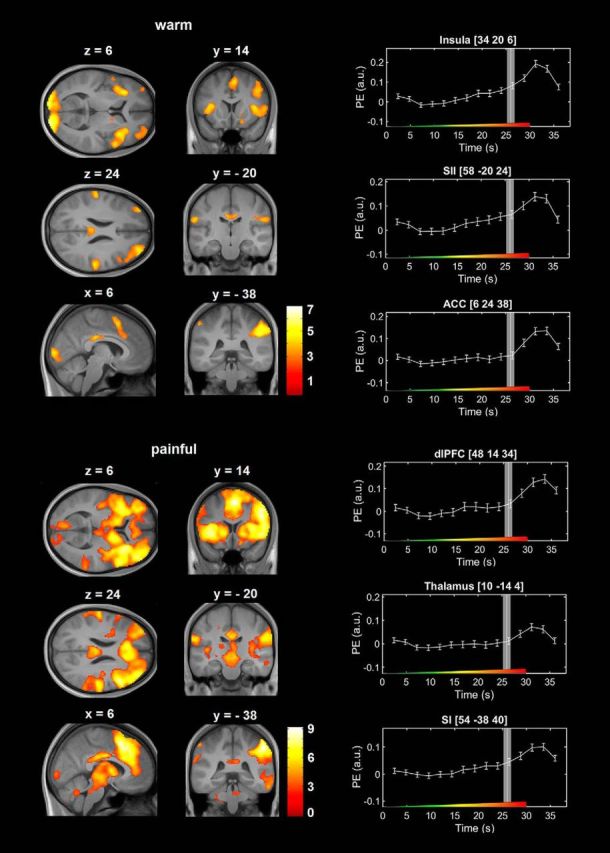
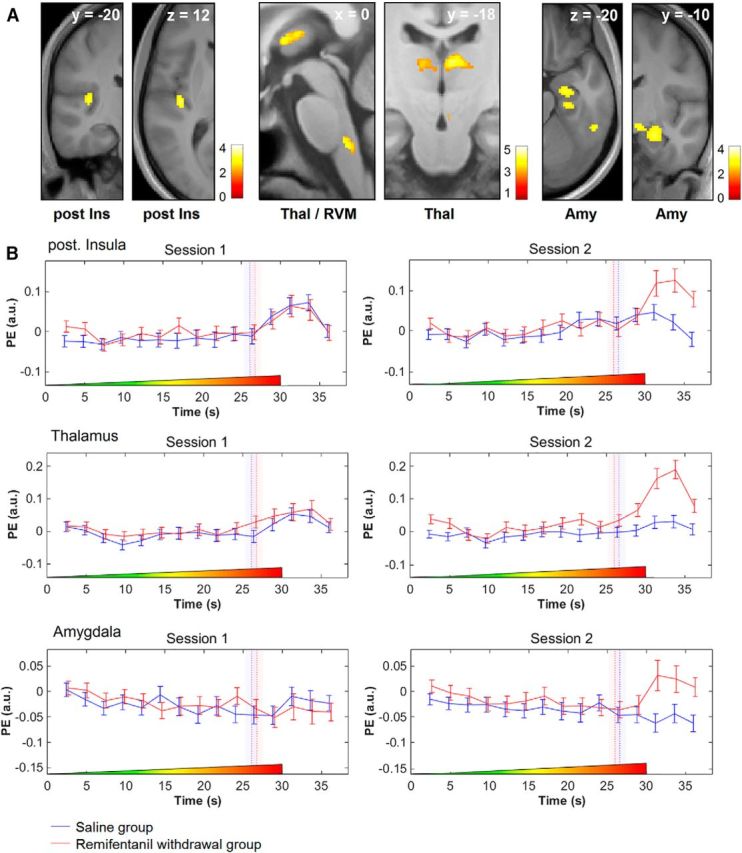
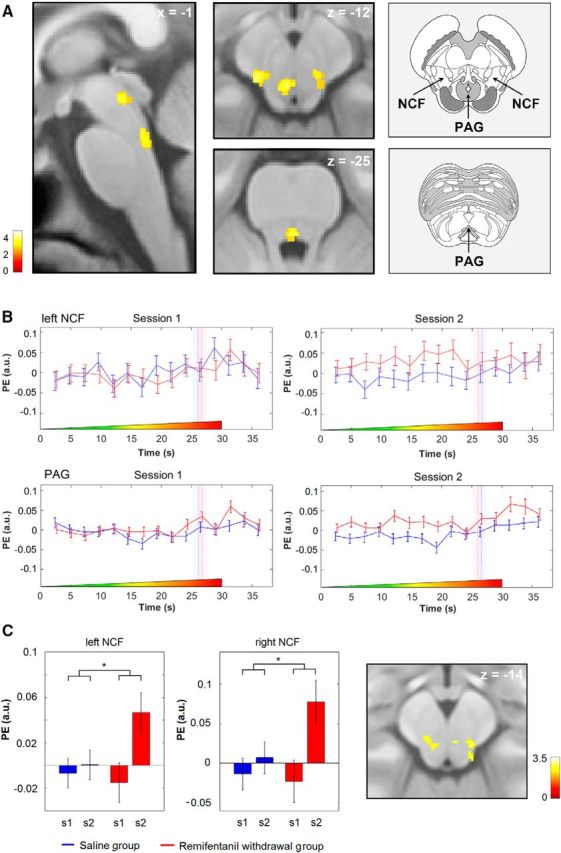
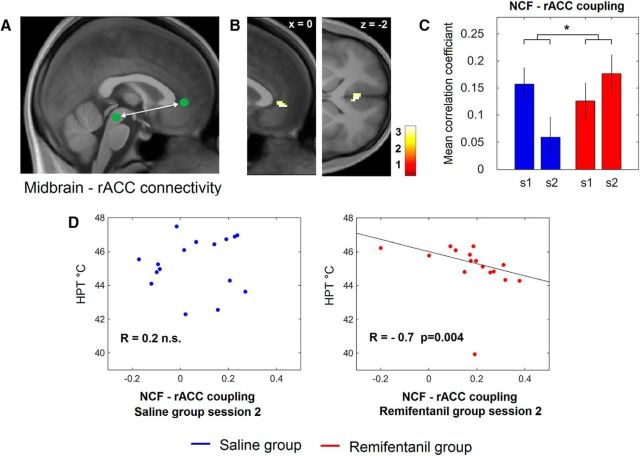
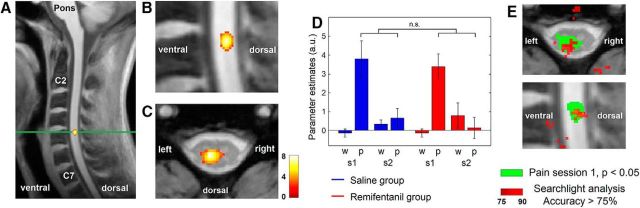
μ-Opioid receptor agonists are widely used within the contemporary treatment of pain, but abrupt opioid suspension, even after short-term infusion, can paradoxically increase the sensitivity to noxious stimuli, a phenomenon that has been, for example, reported after application of the fast-acting μ-opioid receptor agonist remifentanil. To investigate the mechanisms underlying the effects of discontinuation of remifentanil application on pain processing in the human CNS, we analyzed neuronal responses to thermal stimuli before and after a short-term infusion of remifentanil (30 min 0.1 μg/kg body weight/min) compared with control in the brain, brainstem, and spinal cord in drug-naive male volunteers using fMRI. Subsequent to remifentanil suspension, we observed reduced heat pain thresholds and increased neuronal responses in pain-encoding as well as in key regions of the descending pain-modulatory system, such as the periaqueductal gray matter, the nucleus cuneiformis, and the rostral ventromedial medulla. Moreover, the spinal pain-related multivoxel activity pattern showed an opioid-specific change after drug suspension. Importantly, remifentanil suspension increased the functional coupling between the nucleus cuneiformis and the rostral anterior cingulate cortex, and the coupling strength between the rostral anterior cingulate cortex and the nucleus cuneiformis correlated negatively with the individual pain threshold after opioid suspension. These findings demonstrate that, already subsequent to a short-term infusion of the μ-opioid receptor agonist remifentanil, signaling in the descending pain-modulatory system is fundamentally altered and that these changes are directly related to the behavioral sensitivity to pain.SIGNIFICANCE STATEMENT Opioids are widely used in modern medicine, but, in addition to their known side effects, it is increasingly recognized that opioids can also increase sensitivity to pain subsequent to their use. Using the fast-acting μ-opioid receptor agonist remifentanil and fMRI in healthy male volunteers, this study demonstrates how signaling changes occur along the entire descending pain-modulatory pathway after opioid discontinuation and how these alterations are closely linked to increased behavioral pain sensitivity. Particularly by revealing modified responses in pain-modulatory brainstem regions that have been previously demonstrated to be causally involved in acute opioid withdrawal effects in rodents, the data provide a plausible neuronal mechanism by which the increased sensitivity to pain after opioid suspension is mediated in humans.

Keywords: fMRI; opioids; pain; remifentanil.


Figures

Figure 1.
Figure 1.
Experimental procedure. A, Both fMRI experiments used the same experimental protocol. Volunteers were randomly assigned to either a control or a remifentanil group. After measuring BOLD responses to thermal stimuli during a baseline fMRI session, volunteers in the remifentanil group received an intravenous infusion of 0.1 μg remifentanil per kilogram body weight per minute for 30 min. Volunteers in the control group received the same amount of physiological saline solution for the same period. After a waiting period of 1 h, a second identical fMRI session followed. B, During each session, we applied 13 ascending thermal stimuli to the left radial forearm (dermatome C6), starting at a temperature of 32°C and rising over 30 s with a constant slope of 0.5°C per second up to 47°C. This stimulation caused a nonpainful warm sensation during the first seconds of stimulation and a painful sensation during the latter phase. During the first, seventh, and 13th trials, participants indicated by pressing a button (green triangle) when their HPT was reached. Subsequently to the thermal stimulus, after a short pause, participants rated the level of pain present during that trial on a VAS: 0–100, “no pain” to “unbearable pain.” Finally, a variable intertrial interval (ITI) followed.
Figure 2.
Figure 2.
Behavioral effects of remifentanil suspension. A, Experiment 1. B, Experiment 2. VAS ratings of both experiments show that the latter phase of thermal stimulation caused a painful sensation that remained approximately stable over time and did not significantly differ between pharmacological groups before and after application of the test substance. In contrast, remifentanil suspension reduces the HPT compared with saline application. The interaction effects (rightmost panels) show the differences of the average pain ratings and HPTs, respectively, between the first and the second session for both groups separately. Error bars indicate SEM. *p < 0.05.
Figure 3.
Figure 3.
BOLD responses to the nonpainful and painful phase of ascending thermal stimulation in the brain during the baseline session across all participants. The marked activation of the visual cortex during the nonpainful phase of stimulation is most likely explained by the change of the color of the visually presented crosshair at the beginning of each trial. Right, Peristimulus time courses from selected brain regions. Vertical white lines indicate the HPT in seconds after stimulus onset. Gray bars represent the SEM of the HPT. Color bars represent t values. Error bars indicate SEM. Colored ramp at the bottom of each box represents the ascending thermal stimulus. PE (a.u.), Parameter estimates (arbitrary units).
Figure 4.
Figure 4.
Increased BOLD responses after remifentanil discontinuation during the painful period of stimulation compared with control. A, Activation maps show that BOLD responses in the posterior insula (post Ins), the thalamus (Thal), the amygdala (Amy), and the rostral ventro-medial medulla (RVM) are stronger after discontinuation of remifentanil compared with the saline control group during the painful period of stimulation. The visualization threshold is set to p < 0.005 uncorrected. Color bars represent t values. B, The peristimulus time course in the posterior insula, thalamus, and the amygdala shows a very similar progression during the first session for both groups. After discontinuation of remifentanil, the peristimulus time course displays a selective increase after exceeding the HPT in these regions. The time course of the control group is slightly shifted to the left to avoid overlapping of error bars. Dashed vertical lines indicate the HPT in seconds. Bars in transparent color represent the SEM of the HPT. Notice the shift of HPTs from the first to the second experimental session. Colored ramps at the bottom of each box represent the temporal profile of ascending thermal stimulus. Error bars indicate SEM. PE (a.u.), Parameter estimates (arbitrary units).
Figure 5.
Figure 5.
Increased BOLD responses after discontinuation of remifentanil during the nonpainful period of stimulation compared with control and parametric modulation. A, Activation maps show that BOLD responses in the bilateral NCF and in two portions of the PAG are stronger after discontinuation of remifentanil compared with the saline control group during the nonpainful phase of stimulation. Right, Anatomical images represent the localization of these structures in the brainstem. Modified with permission from Naidich (2009). B, The peristimulus time course in the left NCF and the PAG shows a BOLD signal increase during the nonpainful phase of stimulation after remifentanil suspension compared with control. The time course of the control group was slightly shifted to the left to avoid overlapping of error bars. Dashed vertical lines indicate the HPTs in seconds after stimulus onset. Bars in transparent color represent SEM of the HPT. Colored ramps at the bottom of each box represent the ascending thermal stimulus. C, The peak voxel parameter estimates of an analysis using the trial-by-trial VAS ratings as parametric modulator show a positive correlation between the heat pain ratings and the trialwise responses in the NCF during the nonpainful phase of stimulation exclusively after opioid suspension. Right, Statistical map represents the localization of this finding in the brainstem. The visualization threshold is set to p < 0.005 uncorrected. Error bars indicate SEM. Color bars represent t values. PE (a.u.), Parameter estimates (arbitrary units). *p < 0.05.
Figure 6.
Figure 6.
Functional connectivity of the right NCF and the rACC. A, Approximate location of the NCF and the rACC depicted on the mediosagittal plane of the average structural image. To test for NCF-rACC connectivity, we first determined the seed voxel by the contrast testing for increased responses after remifentanil discontinuation during the nonpainful phase of stimulation (see Fig. 5). B, Subsequently, we used the time series from the NCF as predictor in a new GLM analysis to test for remifentanil discontinuation-related changes in connectivity. We identified the rACC in a second-level group analysis. C, We finally extracted also the time series from the rACC and correlated the rACC time series with those from the NCF. While the intraindividual strength of coupling (as represented by the average correlation coefficient) showed a marked decrease from Session 1 (s1) to Session 2 (s2) in the control group, the coupling strength increased during the second session after remifentanil suspension, leading to a significant interaction effect between groups. Error bars indicate SEM. *p < 0.05. D, The individual NCF-rACC coupling strength shows a negative correlation with the HPT after discontinuation of remifentanil (right), but not after saline application (left). Right, The fitted line was determined by a robust regression.
Figure 7.
Figure 7.
Spinal results. A, Spinal BOLD response to the painful phase of stimulation during the baseline session across all participants. The activation can be most likely attributed to the spinal segment C6. Green line indicates the transverse section (C). B, Enlarged detail of the sagittal depiction (A). C, BOLD responses overlaid on a transversal section of a structural T2*-weighted image. The figure shows that the peak of the BOLD response is located in deeper sections the dorsal horn, ipsilateral to the side of stimulation (left). Color bar represents t values. The visualization threshold is set to p < 0.005 uncorrected. D, The parameter estimates at the peak voxel of the BOLD response to painful stimulation show a comparable BOLD response to the painful phase of stimulation (p) in both groups during the baseline session (s1), but no detectable response for the nonpainful period of thermal stimulation (w). BOLD responses to painful stimulation are strongly reduced during the second experimental session (s2) hindering the uncovering of opioid suspension-related group differences. Error bars indicate SEM. E, However, an MVPA was able to successfully decode the pharmacological condition based on the activity patterns during the second experimental session in a previously identified region in the spinal cord that showed a strong positive BOLD response to painful stimulation (see Results). To investigate the specificity of our findings regarding the involved neuronal pathway, we subsequently conducted a searchlight MVPA across the entire measured volume that likewise compared the spinal activity patterns between the remifentanil and the saline group during the second session. The figure shows spatial coincidence of high predictive values in the accuracy map (red, threshold set to average accuracy > 75%) with the region in the spinal cord that showed a significant BOLD response to painful stimulation (green).

Similar articles

Cited by

References

    1. An X, Bandler R, Ongür D, Price JL (1998) Prefrontal cortical projections to longitudinal columns in the midbrain periaqueductal gray in macaque monkeys. J Comp Neurol 401:455–479. 10.1002/(SICI)1096-9861(19981130)401:4<455::AID-CNE3>3.0.CO;2-6 - DOI - PubMed
    1. Angst MS, Clark JD (2006) Opioid-induced hyperalgesia: a qualitative systematic review. Anesthesiology 104:570–587. 10.1097/00000542-200603000-00025 - DOI - PubMed
    1. Angst MS, Koppert W, Pahl I, Clark DJ, Schmelz M (2003) Short-term infusion of the mu-opioid agonist remifentanil in humans causes hyperalgesia during withdrawal. Pain 106:49–57. 10.1016/S0304-3959(03)00276-8 - DOI - PubMed
    1. Apkarian AV, Bushnell MC, Treede RD, Zubieta JK (2005) Human brain mechanisms of pain perception and regulation in health and disease. Eur J Pain 9:463–484. 10.1016/j.ejpain.2004.11.001 - DOI - PubMed
    1. Atlas LY, Whittington RA, Lindquist MA, Wielgosz J, Sonty N, Wager TD (2012) Dissociable influences of opiates and expectations on pain. J Neurosci 32:8053–8064. 10.1523/JNEUROSCI.0383-12.2012 - DOI - PMC - PubMed

Publication types

MeSH terms