. 2018 Mar 14;38(11):2863-2876.
doi: 10.1523/JNEUROSCI.2362-17.2018. Epub 2018 Feb 13.

Control of Homeostatic Synaptic Plasticity by AKAP-Anchored Kinase and Phosphatase Regulation of Ca2+-Permeable AMPA Receptors

Affiliations

Control of Homeostatic Synaptic Plasticity by AKAP-Anchored Kinase and Phosphatase Regulation of Ca2+-Permeable AMPA Receptors

Jennifer L Sanderson et al. J Neurosci. .

Abstract

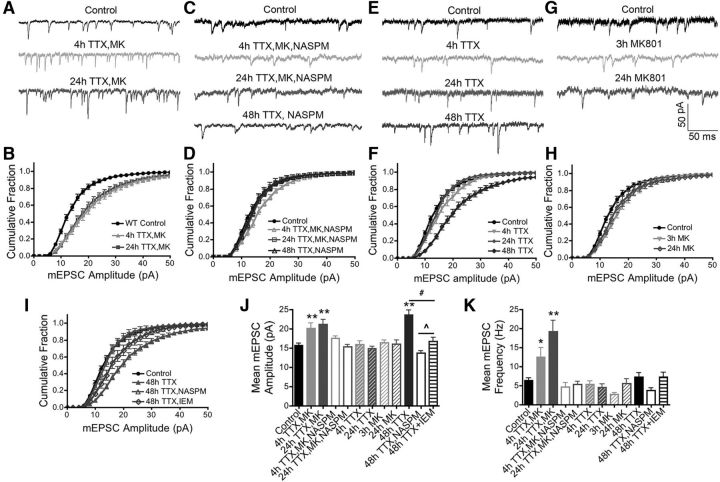
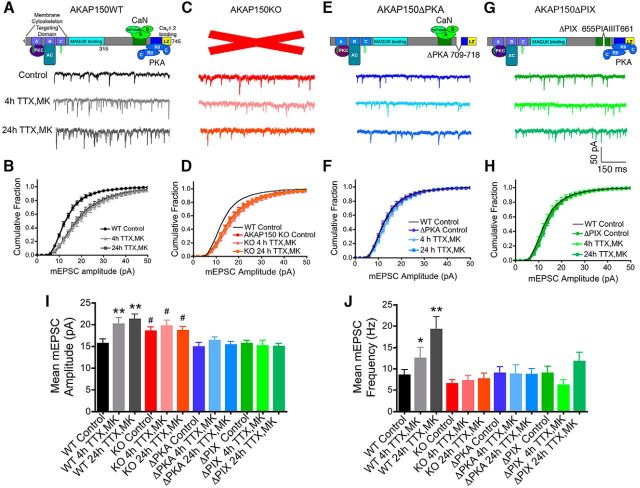
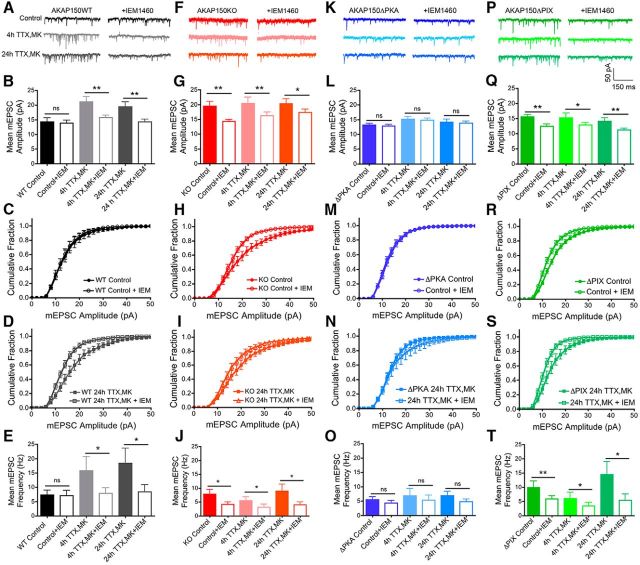
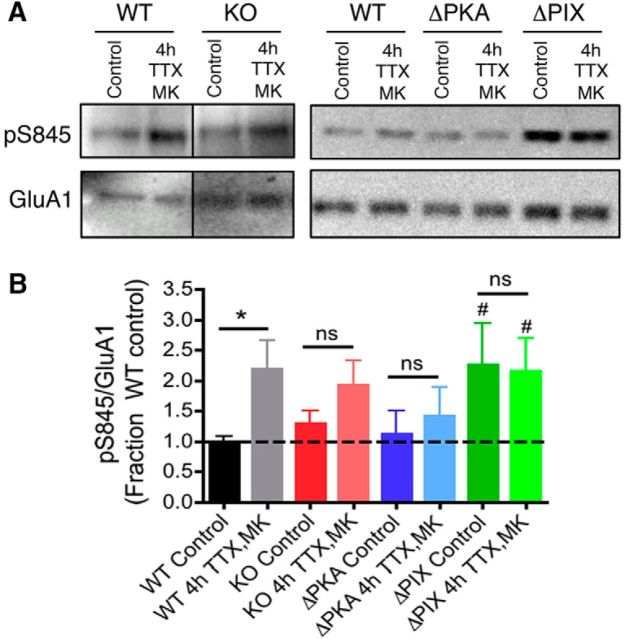
Neuronal information processing requires multiple forms of synaptic plasticity mediated by NMDARs and AMPA-type glutamate receptors (AMPARs). These plasticity mechanisms include long-term potentiation (LTP) and long-term depression (LTD), which are Hebbian, homosynaptic mechanisms locally regulating synaptic strength of specific inputs, and homeostatic synaptic scaling, which is a heterosynaptic mechanism globally regulating synaptic strength across all inputs. In many cases, LTP and homeostatic scaling regulate AMPAR subunit composition to increase synaptic strength via incorporation of Ca2+-permeable receptors (CP-AMPAR) containing GluA1, but lacking GluA2, subunits. Previous work by our group and others demonstrated that anchoring of the kinase PKA and the phosphatase calcineurin (CaN) to A-kinase anchoring protein (AKAP) 150 play opposing roles in regulation of GluA1 Ser845 phosphorylation and CP-AMPAR synaptic incorporation during hippocampal LTP and LTD. Here, using both male and female knock-in mice that are deficient in PKA or CaN anchoring, we show that AKAP150-anchored PKA and CaN also play novel roles in controlling CP-AMPAR synaptic incorporation during homeostatic plasticity in hippocampal neurons. We found that genetic disruption of AKAP-PKA anchoring prevented increases in Ser845 phosphorylation and CP-AMPAR synaptic recruitment during rapid homeostatic synaptic scaling-up induced by combined blockade of action potential firing and NMDAR activity. In contrast, genetic disruption of AKAP-CaN anchoring resulted in basal increases in Ser845 phosphorylation and CP-AMPAR synaptic activity that blocked subsequent scaling-up by preventing additional CP-AMPAR recruitment. Thus, the balanced, opposing phospho-regulation provided by AKAP-anchored PKA and CaN is essential for control of both Hebbian and homeostatic plasticity mechanisms that require CP-AMPARs.SIGNIFICANCE STATEMENT Neuronal circuit function is shaped by multiple forms of activity-dependent plasticity that control excitatory synaptic strength, including LTP/LTD that adjusts strength of individual synapses and homeostatic plasticity that adjusts overall strength of all synapses. Mechanisms controlling LTP/LTD and homeostatic plasticity were originally thought to be distinct; however, recent studies suggest that CP-AMPAR phosphorylation regulation is important during both LTP/LTD and homeostatic plasticity. Here we show that CP-AMPAR regulation by the kinase PKA and phosphatase CaN coanchored to the scaffold protein AKAP150, a mechanism previously implicated in LTP/LTD, is also crucial for controlling synaptic strength during homeostatic plasticity. These novel findings significantly expand our understanding of homeostatic plasticity mechanisms and further emphasize how intertwined they are with LTP and LTD.

Keywords: AKAP150; Ca2+-permeable AMPA receptor; LTP; PKA; calcineurin; homeostatic plasticity.


Figures

Figure 1.
Figure 1.
Homeostatic synaptic potentiation requires synaptic recruitment of CP-AMPARs in hippocampal neurons. A, Representative mEPSC recordings and (B) cumulative plots of mEPSC amplitudes showing scaling-up induced by 4 or 24 h TTX (2 μm) treatment with MK801 (10 μm) also present for the last 3 h (4 h TTX/MK or 24 h TTX/MK) in 15–16 DIV WT mouse hippocampal neurons. C, Representative mEPSC recordings and (D) cumulative plots of mEPSC amplitudes showing that inclusion of NASPM (20 μm) prevents scaling up induced by 4 or 24 h TTX/MK and 48 h TTX treatments. E, Representative mEPSC recordings and (F) cumulative plots of mEPSC amplitudes showing that 48 h TTX but not 4 or 24 h TTX alone induces robust scaling-up. G, Representative mEPSC recordings and (H) cumulative plots of mEPSC amplitudes showing that 3 or 24 h MK801 alone does not induce robust scaling up. I, Cumulative plots of mEPSC amplitudes showing that 48 h TTX induced scaling-up is prevented by NASPM cotreatment and partially reversed by acute treatment with IEM1460 (70 μm). J, Bar graph summaries of data in AI for regulation of mean mEPSC amplitude and (K) frequency. *p < 0.05, **p < 0.01 to Control by one-way ANOVA; #p < 0.05, ∧p < 0.05 by t test. Error bars indicate SEM.
Figure 2.
Figure 2.
Rapid homeostatic synaptic potentiation in hippocampal neurons requires AKAP150-anchoring of both PKA and CaN: disruption by knock-out of AKAP150 (KO) and genetic deletion of PKA-anchoring (ΔPKA) or CaN-anchoring (ΔPIX). A, Representative mEPSC recordings and (B) cumulative plots of mEPSC amplitudes showing scaling-up induced by 4 or 24 h TTX (2 μm) with MK801 (10 μm) present for the last 3 h (4 h TTX/MK or 24 h TTX/MK) in 15–16 DIV WT mouse hippocampal neurons (data are reproduced from Fig. 1A and B). C, Representative mEPSC recordings and (D) cumulative plots of mEPSC amplitudes showing that scaling-up induced by 4 or 24 h TTX/MK treatment is absent in neurons from AKAP150 KO mice. Under basal conditions AKAP150 KO neurons already exhibit a rightward shift in mEPSC amplitude distribution toward larger amplitudes compared with WT controls (black line) and the 4 and 24 h TTX/MK treatments fail to produce any additional shifts. E, Representative mEPSC recordings and (F) cumulative plots of mEPSC amplitudes showing that scaling-up induced by 4 or 24 h TTX/MK is absent in neurons from PKA anchoring-deficient AKAP150ΔPKA mice. G, Representative mEPSC recordings and (H) cumulative plots of mEPSC amplitudes showing that scaling-up induced by 4 or 24 h TTX/MK is absent in neurons from CaN anchoring-deficient AKAP150ΔPIX mice. Bar graph summaries of data in AH showing the 4 and 24 h TTX/MK conditions induce significant increases in mean mEPSC (I) amplitude and (J) frequency in hippocampal neurons from WT but not from AKAP150 KO, ΔPKA, or ΔPIX mice. *p < 0.05, **p < 0.01 to corresponding Controls by one-way ANOVA; #p < 0.05 to WT Control by one-way ANOVA. Error bars indicate SEM.
Figure 3.
Figure 3.
Rapid homeostatic synaptic potentiation in hippocampal neurons requires CP-AMPAR synaptic recruitment that is mediated by AKAP150-anchored PKA and opposed by AKAP150-anchored CaN. A, Representative mEPSC recordings, (B) bar graph of mean mEPSC amplitude, (C, D) cumulative plots of mEPSC amplitudes, and (E) bar graph of mean mEPSC frequency showing that the CP-AMPAR antagonist IEM1460 (70 μm) acutely inhibits expression of rapid homeostatic scaling-up in WT mouse neurons. The same neurons were recorded for a 4–5 min baseline period followed by 5–10 min of additional recording in IEM1460. IEM significantly depresses mEPSC amplitude and frequency after induction of homeostatic scaling up with 4 h TTX/MK (*p < 0.05, **p < 0.01 to +IEM by unpaired t test) but not under Control conditions. F, Representative mEPSC recordings, (G) bar graph of mean mEPSC amplitude,(H, I) cumulative plots of mEPSC amplitudes, and (J) bar graph of mean mEPSC frequency showing that neurons from AKAP150KO mice express IEM1460-sensitive synaptic CP-AMPARs that are responsible for basally increased mEPSC activity (*p < 0.05, **p < 0.01 to +IEM by paired t test) and occlude homeostatic scaling-up in response to 4 h TTX/MK (*p < 0.05, **p < 0.01 to +IEM by paired t test) and 24 h TTX/MK treatments (*p < 0.05, **p < 0.01 to +IEM by paired t test). K, Representative mEPSC recordings, (L) bar graph of mean mEPSC amplitude, (M, N) cumulative plots of mEPSC amplitudes, and (O) bar graph of mean mEPSC frequency showing that impaired homeostatic scaling-up in neurons from AKAP150ΔPKA mice is associated with a failure to recruit CP-AMPARs to synapses following TTX/MK treatments. P, Representative mEPSC recordings, (Q) bar graph of mean mEPSC amplitude, (R, S) cumulative plots of mEPSC amplitudes, and (T) bar graph of mean mEPSC frequency showing that neurons from AKAP150ΔPIX mice express IEM1460-sensitive synaptic CP-AMPARs under control conditions (**p < 0.01 to +IEM by paired t test) that prevent homeostatic scaling-up in response to subsequent TTX/MK treatments, despite not exhibiting any basal increases in mEPSC amplitude (*p < 0.05, **p < 0.01 to +IEM by paired t test). Error bars indicate SEM.
Figure 4.
Figure 4.
Induction of rapid homeostatic synaptic potentiation in hippocampal neurons increases phosphorylation of GluA1–S845 by AKAP150-anchored PKA in opposition to AKAP150-anchored CaN. A, Representative immunoblots of whole-cell extracts of hippocampal neurons cultured from WT, AKAP150 KO, ΔPKA, or ΔPIX mice to detect phospho-GluA1-S845 (pS845) levels followed by stripping and re-probing to detect total GluA1 levels. Note: Left, Extracts from WT and KO were analyzed on the same blot using the same exposures, but then the lanes were rearranged for presentation. B, Quantification of the ratio of pS845/total GluA1 normalized to WT control (always present on the same blot) shows that induction of rapid homeostatic scaling-up with 4 h TTX/MK significantly increases S845 phosphorylation in neurons from WT (*p < 0.05 by unpaired t test) but not AKAP150 KO or ΔPKA mice. Neurons from AKAP150ΔPIX mice already exhibit increased basal S845 phosphorylation and do not show any further increase after 4 h TTX/MK treatment (#p < 0.05 to WT Control by unpaired t test). Error bars indicate SEM.
Figure 5.
Figure 5.
Induction of rapid homeostatic synaptic potentiation increases synaptic GluA1 localization in hippocampal neurons cultured from WT but not AKAP150 KO, ΔPKA, or ΔPIX mice. A, Representative images showing total GluA1 (magenta) and PSD-95 (green) colocalization (white) in 16 DIV hippocampal neurons cultured from WT, AKAP150 KO, ΔPKA, or ΔPIX mice under control conditions or after induction of rapid homeostatic scaling-up with 4 h TTX/MK treatment. Bottom, Magnifications of dendrites. Scale bars, 5 μm. B, Quantification of fold-change in total synaptic GluA1 colocalization with PSD-95 from images as in A using Pearson's correlation (r) shows that induction of homeostatic scaling-up with 4 h TTX/MK significantly increases GluA1/PSD-95 colocalization in WT (***p < 0.001 to Control by unpaired t test) but not KO or ΔPKA mouse neurons (both NS p > 0.05 to Controls by unpaired t test). Total GluA1/PSD-95 colocalization actually decreases slightly in ΔPIX mouse neurons after 4 h TTX/MK (*p < 0.05 to Control by unpaired t test). Error bars indicate SEM. C, Representative images showing surface GluA1 (magenta) and PSD-95 (green) colocalization (white) in 16 DIV hippocampal neurons cultured from WT, AKAP150 KO, ΔPKA, or ΔPIX mice under control conditions or after induction of rapid homeostatic scaling-up with 4 h TTX/MK treatment. Bottom, Magnifications of dendrites. Scale bars, 5 μm. D, Quantification of fold-change in synaptic surface GluA1 colocalization with PSD-95 from images as in C using Pearson's correlation (r) shows that induction of homeostatic scaling-up with 4 h TTX/MK treatment increases surface GluA1/PSD-95 colocalization in WT mouse neuron (***p < 0.0001 to Control by unpaired t test) significantly more than in KO or ΔPKA mouse neurons (both *p < 0.05 to corresponding Controls by unpaired t test and ##p < 0.01 to WT 4 h TTX/MK by one-way ANOVA). Surface GluA1/PSD-95 colocalization is unchanged in ΔPIX mouse neurons after 4 h TTX/MK (NS p > 0.05 to Control by unpaired t test). Error bars indicate SEM.

Similar articles

Cited by

References

    1. Adesnik H, Nicoll RA (2007) Conservation of glutamate receptor 2-containing AMPA receptors during long-term potentiation. J Neurosci 27:4598–4602. 10.1523/JNEUROSCI.0325-07.2007 - DOI - PMC - PubMed
    1. Altimimi HF, Stellwagen D (2013) Persistent synaptic scaling independent of AMPA receptor subunit composition. J Neurosci 33:11763–11767. 10.1523/JNEUROSCI.1102-13.2013 - DOI - PMC - PubMed
    1. Ancona Esselmann SG, Díaz-Alonso J, Levy JM, Bemben MA, Nicoll RA (2017) Synaptic homeostasis requires the membrane-proximal carboxy tail of GluA2. Proc Natl Acad Sci U S A 114:13266–13271. 10.1073/pnas.1716022114 - DOI - PMC - PubMed
    1. Anggono V, Clem RL, Huganir RL (2011) PICK1 loss of function occludes homeostatic synaptic scaling. J Neurosci 31:2188–2196. 10.1523/JNEUROSCI.5633-10.2011 - DOI - PMC - PubMed
    1. Aoto J, Nam CI, Poon MM, Ting P, Chen L (2008) Synaptic signaling by all-trans retinoic acid in homeostatic synaptic plasticity. Neuron 60:308–320. 10.1016/j.neuron.2008.08.012 - DOI - PMC - PubMed

Publication types

MeSH terms

Substances