. 2018 Feb 13;9(1):656.
doi: 10.1038/s41467-018-02993-8.

Fluorogenic RNA Mango aptamers for imaging small non-coding RNAs in mammalian cells

Affiliations

Fluorogenic RNA Mango aptamers for imaging small non-coding RNAs in mammalian cells

Alexis Autour et al. Nat Commun. .

Abstract

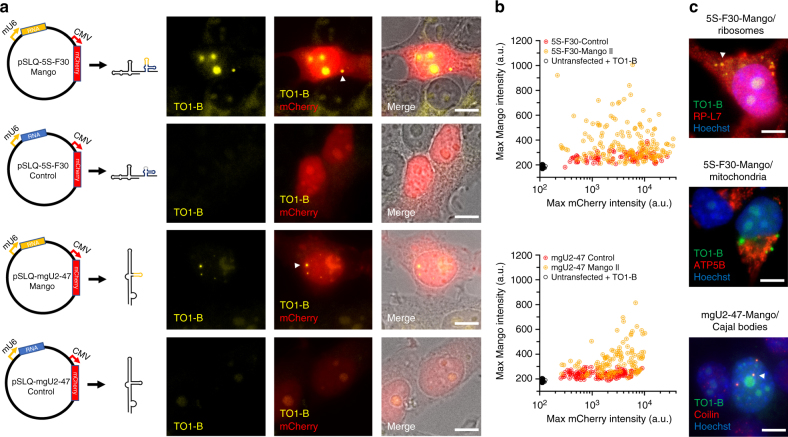
Despite having many key roles in cellular biology, directly imaging biologically important RNAs has been hindered by a lack of fluorescent tools equivalent to the fluorescent proteins available to study cellular proteins. Ideal RNA labelling systems must preserve biological function, have photophysical properties similar to existing fluorescent proteins, and be compatible with established live and fixed cell protein labelling strategies. Here, we report a microfluidics-based selection of three new high-affinity RNA Mango fluorogenic aptamers. Two of these are as bright or brighter than enhanced GFP when bound to TO1-Biotin. Furthermore, we show that the new Mangos can accurately image the subcellular localization of three small non-coding RNAs (5S, U6, and a box C/D scaRNA) in fixed and live mammalian cells. These new aptamers have many potential applications to study RNA function and dynamics both in vitro and in mammalian cells.


Conflict of interest statement

P.J.U., M.R., S.J., A.A., A.Ab. and S.S.S.P. have filed a provisional patent on aspects of this work. The remaining authors declare no competing financial interests.

Figures

Fig. 1
Fig. 1
RNA Mango aptamers core sequences. Colour-coded alignment of RNA Mango I, II, III and IV. G residues in yellow are protected from dimethyl sulfate (DMS) cleavage when folded in the presence of fluorophore. Quadruplex stacks and their associated propeller sequences are numbered 1 through 4. The GAAA isolation motif of Mango I, together with two adenines essential for binding, are shown in green and red respectively. Purple shading represents a flanking stem region for all four Mango aptamers. Schematic: a tertiary structure of Mango I, showing tier 1, 2 and 3 of its quadruplex structure (T1, T2 and T3) and colour-coded as in top panel. TO1-B is shown in green. Bottom: top view of the Mango I core (PDB ID: 5V3F), showing the T3 tier of the quadruplex and relevant propeller residues, colour coding matches the schematic and top panel
Fig. 2
Fig. 2
Competitive selection of TO1-B-binding variants using droplet-based microfluidics fluorescence screening. a Experimental workflow for microfluidic-assisted fluorescence screening. Ovals and boxes represent on- and off-chip steps, respectively. Three microfluidic devices were used for gene individualization in 2.5 pL droplets containing PCR mixture; after thermocycling, fusing each PCR droplet with a droplet containing an in vitro transcription (IVT) mixture supplemented with TO1-B and competitor (NMM or TO3-Biotin); and, after incubation, analysing the fluorescence profile of each droplet and sorting them accordingly. b Fluorescence profile of droplets containing Mango I or the initial R12 library (~200,000 variants, Supplementary Table 1). Droplets containing no DNA have a fluorescence of 10 RFUs. c Improvement in fluorescence enhancement of aptamer libraries during the screening process in the presence of increasing amounts of NMM. The fluorescence (black dots) of the RNA libraries in complex with TO1-B was determined by mixing 2 µM RNA and 100 nM TO1-B in the absence of NMM. These values were normalized to that of the starting library (R12). The values are the mean of three independent experiments and error bars correspond to ±1 standard error. d Enhancement in fluorescence resulting from selection with TO3-Biotin competitor. The fluorescence (black circles) was determined after each round by mixing 300 nM RNA and 100 nM TO1-B in the absence of TO3-Biotin. The values were normalized to that of the starting library (R12). The blue bars represent the concentration of competitor used in each round of selection. The values are the mean of three independent experiments and error bars correspond to ±1 standard error, and for each sort, the gated populations can be found in Supplementary Fig. 3
Fig. 3
Fig. 3
RNA Mango aptamers fluorophore-binding and DMS protection. a Fluorescence binding curves for each Mango aptamer determined by titrating RNA aptamer concentration while holding TO1-B fluorophore constant at 10 nM. KD values are shown next to each titration. b Same as for a but using 1.4 nM TO3-Biotin. Data for a and b have been normalized such that Mango I has a maximum RFU of 1 in each case. Error bars are standard deviation of three replicates. c DMS chemical protection patterns for the four Mango aptamers. 3′ end-labelled RNA (32P  pCp shown as a black asterisk) was subjected to DMS chemical modification followed by reduction by NaBH4 and aniline cleavage as described in the methods. RNA sequences are displayed to the right of each set of lanes with stem portions represented as purple blocks. Legend: T1—denatured T1 ladder; OH—partial alkaline hydrolysis ladder; (−) DMS—denatured reaction with ddH2O added in place of DMS; 80 °C DMS—denatured DMS ladder; remaining lanes are native DMS reactions with addition of potassium to 140 mM final (+KCl), addition of sodium to 140 mM final (+NaCl), with or without 500 nM TO1-B (+TO1-B). Red asterisk indicates a notably unprotected G in Mango IV. Red daggers in Mango II and Mango IV indicate nucleotides presumed to be looped out in the T3 layer relative to the Mango I G stack shown in Fig. 1
Fig. 4
Fig. 4
Cellular imaging of Mango IV tagged RNAs. a Maximum projections of fixed cells containing Mango IV tagged 5S and U6 RNAs stained with 200 nM TO1-B (yellow) and 1 µg/mL Hoechst 33258 (blue)—construct diagrams shown as RNA-Mango (yellow) or non-fluorescent control RNA (grey), F30 folding scaffold (blue) and remaining RNA sequence (black). b Mean intensity distributions of 5S-Mango IV and U6-Mango IV foci (yellow) compared to low intensity foci detected in control experiments (black). Fraction of foci observed in the cytoplasm and nucleus for 5S and U6-Mango IV RNAs (bottom panel, *p < 0.05 and **p < 0.01 calculated using a t test). The number of cells for 5S-F30-Control, 5S-F30-Mango IV, U6-Control and U6-Mango IV were 57, 114, 131 and 183, respectively. Error bars depict standard error in the mean. c Localization of 5S-Mango IV and U6-Mango IV relative to immunostained ribosomes (RP-S6), mitochondria (ATP-5B) and snRNPs (LSm3). Scale bars are 10 μm. All images are maximum projections except in c, which show a single focal plane
Fig. 5
Fig. 5
Cellular imaging of genetically encoded Mango II-tagged RNAs. a Diagram of plasmid constructs with the 5S rRNAs and mgU2-47 scaRNAs under the control of a murine U6 promoter (Pol III) and co-expression of a mCherry reporter gene (CMV promoter). Shown adjacent are images of individual slices of fixed cells either expressing Mango II-tagged RNAs (top) or control RNAs (bottom) with the TO1-B (200 nM) signal in yellow, mCherry in red and brightfield image in greyscale. Arrows depict significant cellular and nuclear foci. Scale bar = 10 µm. b 2D maximum intensity plots of individual nucleoli and Mango II specific foci for both the TO1-B signal (y axis) and mCherry signal (x axis—log10 scale). The number of cells for 5S-F30-Control, 5S-F30-Mango II, untransfected cells + TO1-B, mgU2-47 Control and mgU2-47 Mango II were 89, 167, 98, 130 and 117 respectively. c Maximum projections of cytoplasmic 5S-F30-Mango IV foci and nuclear mgU2-47 foci from plasmid expression in conjunction with immunostained ribosomes (RP-L7), mitochondria (ATP5B) and Cajal bodies (Coilin). Arrows depict significantly co-localized foci, scale bar = 10 µm

References

    1. Paige JS, Wu KY, Jaffrey SR. RNA mimics of green fluorescent. Protein Sci. 2011;333:642–646. - PMC - PubMed
    1. Strack RL, Disney MD, Jaffrey SR. A superfolding Spinach2 reveals the dynamic nature of trinucleotide repeat-containing RNA. Nat. Methods. 2013;10:1219–1224. doi: 10.1038/nmeth.2701. - DOI - PMC - PubMed
    1. You M, Jaffrey SR. Structure and mechanism of RNA mimics of green fluorescent protein. Annu. Rev. Biophys. 2015;44:187–206. doi: 10.1146/annurev-biophys-060414-033954. - DOI - PubMed
    1. Ouellet J. RNA fluorescence with light-up aptamers. Front. Chem. 2016;4:29. doi: 10.3389/fchem.2016.00029. - DOI - PMC - PubMed
    1. Babendure JR, Adams SR, Tsien RY. Aptamers switch on fluorescence of triphenylmethane dyes. J. Am. Chem. Soc. 2003;125:14716–14717. doi: 10.1021/ja037994o. - DOI - PubMed

Publication types