

doi: 10.1038/s41467-018-03163-6.
Emerging risks from marine heat waves
Affiliations
- PMID: 29440658
- PMCID: PMC5811532
- DOI: 10.1038/s41467-018-03163-6
Item in Clipboard
Emerging risks from marine heat waves
Nat Commun.
.
Abstract
Recent marine heat waves have caused devastating impacts on marine ecosystems. Substantial progress in understanding past and future changes in marine heat waves and their risks for marine ecosystems is needed to predict how marine systems, and the goods and services they provide, will evolve in the future.
Conflict of interest statement
The authors declare no competing financial interests.
Figures
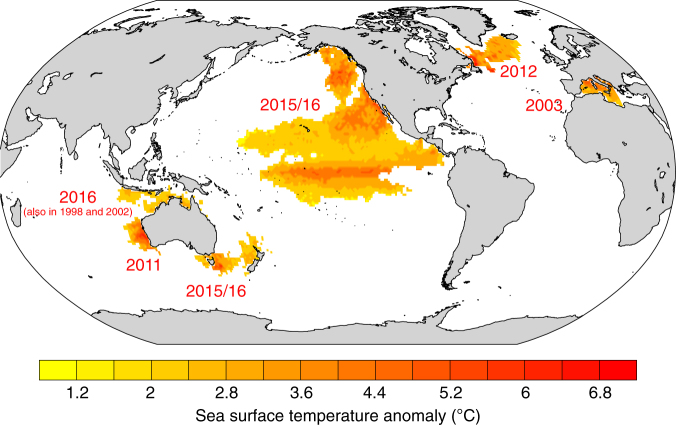
Summary of prominent recent marine heat waves that are documented and analyzed in the literature. The figure shows the maximum sea surface temperature anomaly in regions where temperature exceeds the 99th percentile using NOAA’s daily Optimum Interpolation sea surface temperature dataset. The numbers indicate the year of the MHW occurrence. The 99th percentile is calculated over the 1982–2016 reference period. The map was created using the NCAR Command Language (https://www.ncl.ucar.edu )

The effect of a simple shift towards a warmer climate on the probability of land-based and marine heat waves. a shows the observed distribution of the linearly detrended and deseasonalized local daily surface air temperature anomalies over land using the CRU-NCEP-v8 data set,; b as for a but for local daily sea surface temperature anomalies using NOAA’s daily Optimum Interpolation sea surface temperature data set. Solid black lines show the distributions over the 1982–2016 period and solid gray lines indicate the same shape of the distributions, but the land is shifted by ΔTland = 2°C and the ocean by ΔTocn = 1.33 °C. Here we assume ΔTland/ΔTocn = 1.520. A heat wave is defined as temperature exceeds the 95th percentile (red and blue shaded areas). The inset highlights the changes in land-based heat waves
References
-
- IPCC. Climate Change 2014: Synthesis Report. Contribution of Working Groups I, II and III to the Fifth Assessment Report of the Intergovernmental Panel on Climate Change (Core Writing Team, R.K. Pachauri and L.A. Meyer (eds.)) 151 pp (IPCC, Geneva, Switzerland, 2014).
-
- Hobday AJ, et al. A hierarchical approach to defining marine heatwaves. Prog. Oceanogr. 2016;141:227–238. doi: 10.1016/j.pocean.2015.12.014. - DOI
-
- Garrabou J, et al. Mass mortality in Northwestern Mediterranean rocky benthic communities: effects of the 2003 heat wave. Glob. Chang. Biol. 2009;15:1090–1103. doi: 10.1111/j.1365-2486.2008.01823.x. - DOI
-
- Pearce AF, Feng M. The rise and fall of the ‘marine heat wave’ off Western Australia during the summer of 2010/2011. J. Mar. Syst. 2013;111–112:139–156. doi: 10.1016/j.jmarsys.2012.10.009. - DOI
Publication types
MeSH terms
LinkOut - more resources
Full Text Sources
Other Literature Sources
Miscellaneous
