Comparative Study
. 2018 Feb 13;9(1):490.
doi: 10.1038/s41467-017-02772-x.

The effects of death and post-mortem cold ischemia on human tissue transcriptomes

Affiliations
Comparative Study

The effects of death and post-mortem cold ischemia on human tissue transcriptomes

Pedro G Ferreira et al. Nat Commun. .

Abstract

Post-mortem tissues samples are a key resource for investigating patterns of gene expression. However, the processes triggered by death and the post-mortem interval (PMI) can significantly alter physiologically normal RNA levels. We investigate the impact of PMI on gene expression using data from multiple tissues of post-mortem donors obtained from the GTEx project. We find that many genes change expression over relatively short PMIs in a tissue-specific manner, but this potentially confounding effect in a biological analysis can be minimized by taking into account appropriate covariates. By comparing ante- and post-mortem blood samples, we identify the cascade of transcriptional events triggered by death of the organism. These events do not appear to simply reflect stochastic variation resulting from mRNA degradation, but active and ongoing regulation of transcription. Finally, we develop a model to predict the time since death from the analysis of the transcriptome of a few readily accessible tissues.


Conflict of interest statement

P.G.F., C.O., and P.O. are partners of Bioinf2Bio. The remaining authors declare no competing financial interest.

Figures

Fig. 1
Fig. 1
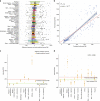
Characteristics of the samples and tissues used in this study. a Distribution of PMI values (in minutes) with tissues ordered by the median value. Whole blood contains samples with negative time corresponding to samples obtained pre-mortem. b Distribution of Pearson correlation between PMI and RIN values. Esophagus, Liver, Colon, Ovary, Uterus, Vagina, and Heart are the tissues in which RIN is more affected by PMI (r < −0.5), while Skin, Pituitary, Spleen and Nerve are the ones in which is less affected (r > −0.1)
Fig. 2
Fig. 2
Effect of PMI on gene expression. a Distribution of the number of genes with significant temporal changes per tissue between at least two time intervals. Brain and pituitary have longer PMIs, only within last two time intervals, thus less interval ranges to detect significant changes. b Heatmap with the number of genes with significant changes detected between two consecutive time intervals. c Heatmap with normalized expression values for genes with changes in liver. The top bar is the color code for the PMI interval of each sample, the right bar list genes involved in the various functions and pathways. On the side we highlight sub-clusters with different patterns of temporal expression. d Example of four genes with different temporal patterns. RNASE2 is a non-secretory ribonuclease involved in several functions; HBA1 is alpha hemoglobin involved in oxygen transport; EGR3 is a transcriptional regulator involved in early growth response; CXCL2 is a chemokine gene that encodes secreted proteins involved in immune and inflammatory processes
Fig. 3
Fig. 3
PMI and gene expression correlation patterns. a Distribution of Pearson correlation between gene expression and PMI, across the different tissues (sorted by sample size, in parenthesis). Only for a few genes, this correlation exceeds an absolute r-value of 0.2. b Clustering based on the ranking (Spearman) correlation of the values in (a) show that sub-tissues of a given tissue or closely related organs have the similar patterns of correlation
Fig. 4
Fig. 4
Effect of PMI on mitochondrial transcription and splicing. a Proportion of RNA-seq reads originating from mitochondrial genes (mtRNA concentration) in early (≤680) and late (>680) PMI intervals. b, c mtRNA concentration depending on PMI in Liver (b) and Ovary (c)
Fig. 5
Fig. 5
Effect of PMI on splicing. a Distribution of the number of exons with significant differential inclusion across the different tissues; inset: number of exons with differential inclusion occurring in multiple tissues. b, c Examples of two exons with PMI-correlated inclusion levels. SRSF3 and SF1 encode pre-mRNA splicing factors that form part of the spliceosome. d Splicing Entropy for the APBB1IP gene depending PMI in the lung tissue. e APBB1IP gene has three isoforms. The heatmap shows the proportion of each isoform in the Lung samples sorted by PMI (1 indicates that only one isoform contributes to the expression of the gene and 0 that the isoform is not expressed) PMI of the samples range from 49 to 1558 minand are represented in the green to red gradient scale bar. Exon structure (not to scale) for the three isoforms is represented below. This figure depicts how the expression of the longer transcript in this gene becomes less dominant as PMI increases, and, as a consequence, the abundance of the different isoforms tends to converge
Fig. 6
Fig. 6
Transcriptional changes in blood after death. a Multi-Dimensional Scaling of blood samples shows separation between pre and post-mortem samples. Samples are colored by the Hardy scale of the cause of death. b Number of genes differentially expressed between the pre-mortem samples and the post-mortem samples stratified at different PMI intervals. Darker filling corresponds to genes that are found as differentially expressed in the previous interval. c The five main temporal patterns of change in functional activities upon organismic death. d Hypoxia seems to play a major role in the pre-to post-mortem transcription as reflected in the way in which the carbohydrate metabolism is affected (activations in red, deactivations in blue). Response to hipoxia is activated from pathways “Platelet activation pathway” and “cGMP-PKG signaling pathway” through the activation of the corresponding circuits that end in the effector gene ITPR1, annotated as Response to hypoxia, and from pathways “HIF-1 signaling pathway” and “cGMP-PKG signaling pathway” through the activation of the effector gene VEGFA. The “HIF-1 signaling pathway” also activates Glycolysis through the activation of different circuits that trigger effector proteins (PDK1, PFKL, ALDOA, etc.) with annotations such as glycolytic process, canonical glycolysis, glucose metabolic process, etc. The “HIF-1 signaling pathway” also inhibits Tricarboxylic acid cycle through the inhibition of circuits that trigger the effector protein PDHA1 with diverse GO annotations such as tricarboxylic acid cycle, acetyl-CoA biosynthetic process from pyruvate or carbohydrate metabolic process
Fig. 7
Fig. 7
Differential cellular composition and splicing entropy in blood. a Cellular composition analysis for 18 cell types shows an increase in NK-cells-resting and T-cells-CD8 and decrease in Neutrophils composition from pre- to post-mortem blood samples. b Splicing entropy in pre- and post-mortem samples for genes of different number of isoforms
Fig. 8
Fig. 8
Prediction of the PMI from gene expression in post-mortem samples. a Distribution of the PMI prediction error per tissue. b Regression of the real PMI versus the predicted individual PMI on the test set of 129 individuals. Plots in panels (c) and (d) illustrate two examples (GTEX-145MN and GTEX-145ME) of the prediction of the PMI for an individual based on the prediction of PMI from each tissue from the individual. For a given tissue, each yellow dot represents a prediction from each one of 13 different models. The black dot is the mean prediction of these 13 models. The green line represents the real PMI value for the individual. The individual PMI prediction is calculated as the average of the final tissue PMI predictions, and is represented by the red line
Fig. 9
Fig. 9
Protocol for post-mortem interval prediction. Steps to be performed to predict the PMI of an individual

References

    1. Bauer M. RNA in forensic science. Forensic Sci. Int. Genet. 2007;1:69–74. doi: 10.1016/j.fsigen.2006.11.002. - DOI - PubMed
    1. Fitzpatrick R, et al. Postmortem stability of RNA isolated from bovine reproductive tissues. Biochim. Biophys. Acta. 2002;1574:10–14. doi: 10.1016/S0167-4781(01)00322-0. - DOI - PubMed
    1. Preece P, et al. An optimistic view for quantifying mRNA in post-mortem human brain. Brain Res. Mol. Brain. Res. 2003;116:7–16. doi: 10.1016/S0169-328X(03)00208-0. - DOI - PubMed
    1. Catts VS, et al. A microarray study of post-mortem mRNA degradation in mouse brain tissue. Brain. Res. Mol. Brain. Res. 2005;138:164–177. doi: 10.1016/j.molbrainres.2005.04.017. - DOI - PubMed
    1. Lee J, Hever A, Willhite D, Zlotnik A, Hevezi P. Effects of RNA degradation on gene expression analysis of human postmortem tissues. FASEB J.: Off. Publ. Fed. Am. Soc. Exp. Biol. 2005;19:1356–1358. doi: 10.1096/fj.04-3552fje. - DOI - PubMed

Publication types