. 2018 Feb 13;8(1):2942.
doi: 10.1038/s41598-018-21103-8.

Folic Acid Exposure Rescues Spina Bifida Aperta Phenotypes in Human Induced Pluripotent Stem Cell Model

Affiliations

Folic Acid Exposure Rescues Spina Bifida Aperta Phenotypes in Human Induced Pluripotent Stem Cell Model

Vardine Sahakyan et al. Sci Rep. .

Abstract

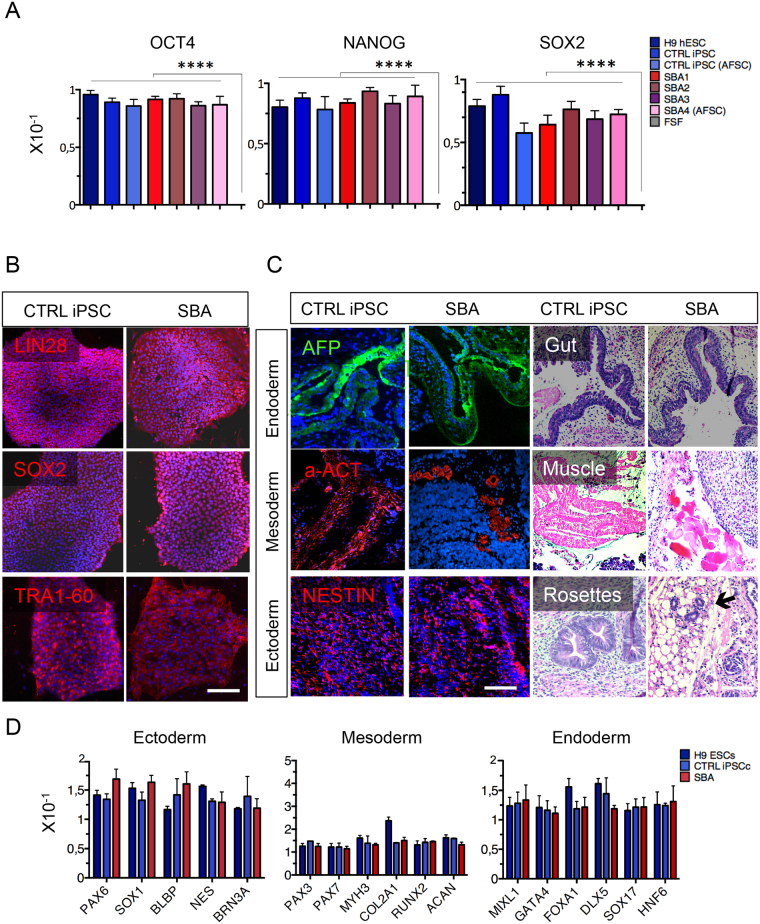
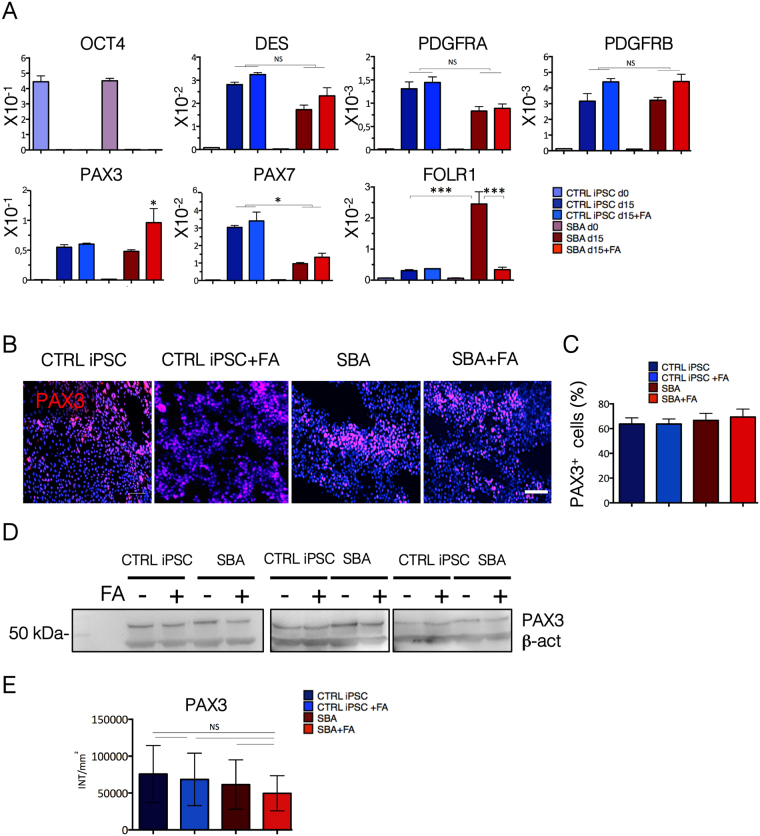
Neural tube defects (NTDs) are severe congenital abnormalities, caused by failed closure of neural tube during early embryonic development. Periconceptional folic acid (FA) supplementation greatly reduces the risk of NTDs. However, the molecular mechanisms behind NTDs and the preventive role of FA remain unclear. Here, we use human induced pluripotent stem cells (iPSCs) derived from fetuses with spina bifida aperta (SBA) to study the pathophysiology of NTDs and explore the effects of FA exposure. We report that FA exposure in SBA model is necessary for the proper formation and maturation of neural tube structures and robust differentiation of mesodermal derivatives. Additionally, we show that the folate antagonist methotrexate dramatically affects the formation of neural tube structures and FA partially reverts this aberrant phenotype. In conclusion, we present a novel model for human NTDs and provide evidence that it is a powerful tool to investigate the molecular mechanisms underlying NTDs, test drugs for therapeutic approaches.


Conflict of interest statement

The authors declare no competing interests.

Figures

Figure 1
Figure 1
Generation of human iPSCs derived from SBA fetuses. (A) qRT-PCR data from CTRL iPSC and SBA lines for pluripotency markers OCT4, NANOG, SOX2 are shown as relative expression to housekeeping gene GAPDH. H9 human ESCs and FSFs were respectively used as a positive and negative control; Data are plotted as average ± SEM. ****P < 0.0001 H9 hESCs, CTRL iPSCs, CTRL iPSC (AFSC), SBA1, SBA2, SBA3, SBA4 (AFSC) vs FSF. N = 4 independent experiments per iPSC line. (B) IF analysis for pluripotency markers SOX2, LIN28 and TRA-1–60 (all in red) in CTRL iPSC and SBA lines. Representative images of CTRL1#2 and SBA2#1 are shown. Nuclei were counterstained in blue with DAPI; scale bar = 100 μm. (C) Teratomas with presence of derivatives of all three-germ layers generated from CTRL iPSC and SBA lines, as illustrated by presence of endoderm: AFP and gut, mesoderm: αSMA and muscle and ectoderm: NESTIN and neural rosettes. Representative images of CTRL1#2 and SBA2#1 are shown; scale bar = 200 μm. (D) qRT-PCR data for the genes representing three-germ layers on H9 ESC, CTRL iPSC and SBA-derived teratomas. Ectodermal (PAX6, SOX1, BLBP, NES, BRN3A), mesodermal (PAX3, PAX7, MYH3, COL2A1, RUNX2, ACAN) and endodermal (MIXL1, GATA4, FOXA1, DLX5, SOX17, HNF6) markers are shown as relative expression to housekeeping gene GAPDH. Data are plotted as average ± SEM. N = 4 independent experiments per iPSC line.
Figure 2
Figure 2
Early neural gene expressions and protein localization in SBA iPSC-derived NSCs. (A) qRT-PCR data of CTRL iPSC and SBA-derived NSCs for pluripotency (OCT4), early neural (PAX6, SOX1, NESTIN) and folate receptor 1 (FOLR1) genes at day 0 and day 12 of neural differentiation are shown as relative expression to housekeeping gene GAPDH. NS, not significant. Data are plotted as average ± SEM. *P < 0.05 CTRL iPSC d12 vs SBA d12 and CTRL iPSC + FA d12 vs SBA + FA d12 (FOLR1). N = 4 independent experiments per iPSC line. See also Supplementary Fig. S4A (B) IF staining for early neural markers PAX6 (red) and NESTIN (green) in CTRL iPSC, H9 hESC and SBA-derived neural rosettes at day 18 of neural differentiation. Representative images of CTRL1#2 and SBA2#1 are shown. Nuclei were counterstained with DAPI (blue). Scale bar = 100 μm.
Figure 3
Figure 3
Polarization and radial-glia commitment of SBA iPSC-derived neural rosettes. (A) IF staining for adherence and tight junction protein markers ZO-1 and N-CAD (both in green) in CTRL iPSC and SBA-derived neural rosettes at day 18 of neural differentiation. Representative images of CTRL1#2 and SBA2#1 are shown. Nuclei were counterstained with DAPI (blue). Scale bar = 100 μm. See also Supplementary Fig. S4B. (B) IF staining analysis for BLBP (green) in CTRL iPSC and SBA-derived neural rosettes at day 18 of neural differentiation. Representative images of CTRL1#2 and SBA2#1 are shown. Nuclei were counterstained with DAPI (blue). Scale bar = 100 μm. (C) qRT-PCR data for early RG marker BLBP at day 0 and 12 from neural differentiation in CTRL iPSC and SBA-derived NSCs shown as relative expression to housekeeping gene GAPDH. NS, not significant. Data are plotted as average ± SEM. *P < 0.05 CTRL iPSC d12 vs SBA d12 and CTRL iPSC + FA d12 vs SBA + FA d12. N = 4 independent experiments per iPSC line. (D) Enumeration of BLBP+ cells in CTRL iPSC and SBA-derived neural rosettes at day 18 of neural differentiation shown as percentage. Data are plotted as average ± SEM. N = 4 independent experiment per iPSC line.
Figure 4
Figure 4
Characterization of 3D spheroids, generated from SBA iPSC-derived neural rosettes. (A) Diameter size (μm) of CTRL iPSC and SBA neural rosettes-derived 3D spheroids shown as percentage. Data are plotted as average ± SEM. **P < 0.01 CTRL iPSC vs SBA and SBA vs SBA + FA, *P < 0.05 CTRL iPSC vs CTRL iPSC + FA. N = 4 independent experiment per iPSC/hESC line. (B) Enumeration of Ki67+ cells in CTRL iPSC and SBA neural rosettes-derived 3D spheroids shown as percentage. NS, not significant. Data are plotted as average ± SEM ****P < 0.0001 CTRL iPSC vs SBA, SBA vs SBA + FA, ***P < 0.001 CTRL iPSC vs CTRL iPSC + FA. N = 4 independent experiment per iPSC line. (C) IF staining for tight junction protein marker ZO-1 (green) and Ki67 (red) in CTRL iPSC and SBA-derived 3D spheroids sections. Representative images of CTRL iPSC1#2 and SBA2#1 are shown. Nuclei were counterstained with DAPI (blue). Scale bar = 200 μm for ZO-1, 100 μm for Ki67. (D) IF staining for early neural differentiation marker β–III Tubulin (red) in CTRL iPSC SBA neural rosettes-derived 3D spheroids sections. Nuclei were counterstained with DAPI (blue). Representative images of CTRL iPSC1#2 and SBA2#1 are shown. Scale bar = 200 μm. (E) Enumeration of β–III Tubulin+ cells in CTRL iPSC and SBA neural rosettes-derived spheroids shown as percentage. Data are plotted as average ± SEM. *P < 0,05 CTRL vs CTRL + FA, **P < 0.01 CTRL iPSC vs SBA, CTRL iPSC + FA vs SBA + FA, SBA vs SBA + FA ****P < 0.0001 CTRL iPSC + FA vs SBA. N = 4 independent experiment per line. (F) IF staining for PAX6 (green), NESTIN (red) and β–III Tubulin (blue) in SBA neural rosettes-derived 3D spheroids sections. Representative images of SBA2#1 are shown. Scale bar = 200 μm.
Figure 5
Figure 5
Effect of MTX exposure on SBA iPSC-derived NSCs and rosettes. (A) qRT-PCR data of CTRL iPSC and SBA-derived NSCs for early neural (PAX6, SOX1, NESTIN), RG (BLBP) and folate receptor 1 (FOLR1) markers at day 12 of neural differentiation is shown as relative expression to housekeeping gene GAPDH. NS, not significant. Data are plotted as average ± SEM. ****P < 0.0001 CTRL iPSC vs CTRL iPSC + MTX and SBA vs SBA + MTX, ***P < 0.001 CTRL iPSC vs CTRL iPSC + MTX/FA and SBA vs SBA + MTX/FA (PAX6), ***P < 0.001 CTRL iPSC vs CTRL iPSC + MTX and CTRL iPSC vs CTRL iPSC + MTX/FA, ****P < 0.0001 SBA vs SBA + FA and SBA vs SBA + MTX/FA (SOX1), *P < 0.05 SBA vs SBA + MTX, SBA vs SBA + MTX/FA and SBA + MTX vs SBA + MTX/FA (NESTIN), *P < 0.05 CTRL iPSC vs CTRL iPSC + MTX, CTRL iPSC vs CTRL iPSC + MTX/FA, CTRL iPSC vs SBA, SBA vs SBA + MTX/FA, ***P < 0.001 SBA vs SBA + MTX (BLBP), ****P < 0.0001 CTRL iPSC vs SBA, CTRL iPSC + MTX vs SBA + MTX, CTRL iPSC + MTX vs SBA + MTX/FA, SBA vs SBA + MTX, SBA + MTX vs SBA + MTX/FA, ***P < 0.001 CTRL iPSC vs CTRL iPSC + MTX and SBA vs SBA + MTX/FA(FOLR1). N = 4 independent experiments per iPSC line. (B) IF staining for early neural markers PAX6 (red) and NESTIN (green) in CTRL iPSC and SBA-derived neural rosettes, at day 18 of neural differentiation. Representative images of CTRL1#2 and SBA2#1 are shown. Nuclei were counterstained with DAPI (blue). Scale bar = 100 μm. (C) Quantification of CTRL iPSC and SBA-derived neural rosettes number, at day 18 of neural differentiation. Data are plotted as average ± SEM. *P < 0.05 CTRL iPSC + MTX vs CTRL iPSC + MTX/FA, SBA + MTX vs SBA + MTX/FA. N = 4 independent experiment per iPSC line.
Figure 6
Figure 6
Osteo-chondrogenic commitment of SBA iPSC lines. (A) qRT-PCR analysis for pluripotency (OCT4), chondrogenic (SOX9, COL2A1, ACAN) and folate receptor 1 (FOLR1) genes at day 0 and day 7 of chondrogenic induction is shown as relative expression to housekeeping gene GAPDH in CTRL iPSCs and SBA-derived chondrocytes. NS, not significant. Data are plotted as average ± SEM. *P < 0.05 CTRL iPSC d7 vs SBA d7, CTRL iPSC + FA d7 vs SBA d7, SBA d7 vs SBA + FA d7 (ACAN). N = 4 independent experiments per iPSC line. (B) ACB staining of micromass cultured from CTRL iPSC and SBA-derived chondrocytes and negative CTRL (CTRL iPSC without chondrogenic induction) at day 7 of chondrogenic differentiation. Representative images of CTRL1#2 and SBA2#1 are shown. Scale bar = 1 mm. (C) Quantification of CTRL iPSC and SBA-derived chondrocytes at day 7 of chondrogenic differentiation, measured by ICN Titertek Multiskan Plus. Data are plotted as average ± SEM. **P < 0.01 CTRL iPSC vs SBA, CTRL iPSC vs SBA + FA, CTRL iPSC + FA vs SBA + FA. N = 4 independent experiments per iPSC line. (D) qRT-PCR data of CTRL iPSCs and SBA-derived osteoblasts for pluripotency (OCT4), osteogenic (RUNX2, OCN) and folate receptor 1 (FOLR1) genes at day 0 and day 21 of osteogenic differentiation is shown as relative expression to housekeeping gene GAPDH. NS, not significant. Data are plotted as average ± SEM. **P < 0.01 CTRL iPSC d21 vs SBA d21, SBA d21 vs SBA + FA d21 (OCN). N = 4 independent experiments per iPSC line. (E) ARS staining of CTRL iPSC and SBA-derived osteocytes and negative CTRL (CTRL iPSC without osteogenic induction) at day 21 of osteogenic differentiation. Representative images of CTRL1#2 and SBA2#1 are shown. Scale bar = 100 μm. (F) Quantification of CTRL iPSC and SBA-derived osteoblasts at day 21 of osteogenic differentiation, measured by ICN Titertek Multiskan Plus. Data are plotted as average ± SEM. **P < 0.01 CTRL iPSC vs SBA, CTRL iPSC + FA vs SBA, *P < 0.05 SBA vs SBA + FA. N = 4 independent experiment per iPSC line.
Figure 7
Figure 7
Early myogenic commitment of SBA iPSC lines. (A) qRT-PCR data of CTRL iPSC and SBA lines for pluripotency (OCT4), mesodermal (DES, PDGFRA, PDGFRB), early myogenic (PAX3, PAX7) and folate receptor 1 (FOLR1) genes at day 0 and day 15 of myogenic differentiation presented as relative expression to housekeeping gene GAPDH. NS, not significant. Data are plotted as average ± SEM. *P < 0.05 SBA d15 vs SBA d15 + FA, CTRL iPSC d15 vs SBA d15 + FA and CTRL iPSC d15 + FA vs SBA d15 + FA (PAX3), *P < 0.05 CTRL iPSC d15 vs SBA d15, CTRL iPSC + FA d15 vs SBA + FA d15 (PAX7), ***P < 0.001 CTRL iPSC d15 vs SBA d15, SBA d15 vs SBA + FA d15 (FOLR1). N = 4 independent experiment per iPSC line. (B) IF staining for PAX3 (red) in CTRL iPSCs and SBA-derived myogenic progenitors at day 15 of myogenic induction. Representative images of CTRL1#2 and SBA2#1 are shown. Nuclei were counterstained with DAPI (blue). Scale bar = 100 μm. (C) Enumeration of PAX3 + cells in CTRL iPSC and SBA lines at day 15 of myogenic induction shown as percentage. Data are plotted as average ± SEM. N = 4 independent experiment per line. (D) WB analysis for PAX3 protein (53 kDa) in CTRL iPSCs and-derived myogenic progenitors. Housekeeping protein β Actin (45 kDA) used as an internal control. The images were cropped on the black lines. Full images of gels/blots can be found in Supplementary Fig. S7. (E) Enumeration of PAX3 protein using QuantityOne Software. NS, not significant. N = 3 independent experiments per line.

Similar articles

Cited by

References

    1. Blom HJ, Shaw GM, den Heijer M, Finnell RH. Neural tube defects and folate: case far from closed. Nat Rev Neurosci. 2006;7:724–731. doi: 10.1038/nrn1986. - DOI - PMC - PubMed
    1. Mitchell LE. Epidemiology of neural tube defects. Am J Med Genet C Semin Med Genet. 2005;135C:88–94. doi: 10.1002/ajmg.c.30057. - DOI - PubMed
    1. Zhu X, et al. A Robust Single Primate Neuroepithelial Cell Clonal Expansion System for Neural Tube Development and Disease Studies. Stem Cell Reports. 2016;6:228–242. doi: 10.1016/j.stemcr.2015.10.007. - DOI - PMC - PubMed
    1. Zaganjor, I. et al. Describing the Prevalence of Neural Tube Defects Worldwide: A Systematic Literature Review. PLoS One11, 10.1371/journal.pone.0151586 (2016). - PMC - PubMed
    1. Yi Y, Lindemann M, Colligs A, Snowball C. Economic burden of neural tube defects and impact of prevention with folic acid: a literature review. Eur J Pediatr. 2011;170:1391–1400. doi: 10.1007/s00431-011-1492-8. - DOI - PMC - PubMed

Publication types

MeSH terms