Perioperative factors associated with pressure ulcer development after major surgery
- PMID: 29441175
- PMCID: PMC5809708
- DOI: 10.4097/kjae.2018.71.1.48
Perioperative factors associated with pressure ulcer development after major surgery
Abstract
Background: Postoperative pressure ulcers are important indicators of perioperative care quality, and are serious and expensive complications during critical care. This study aimed to identify perioperative risk factors for postoperative pressure ulcers.
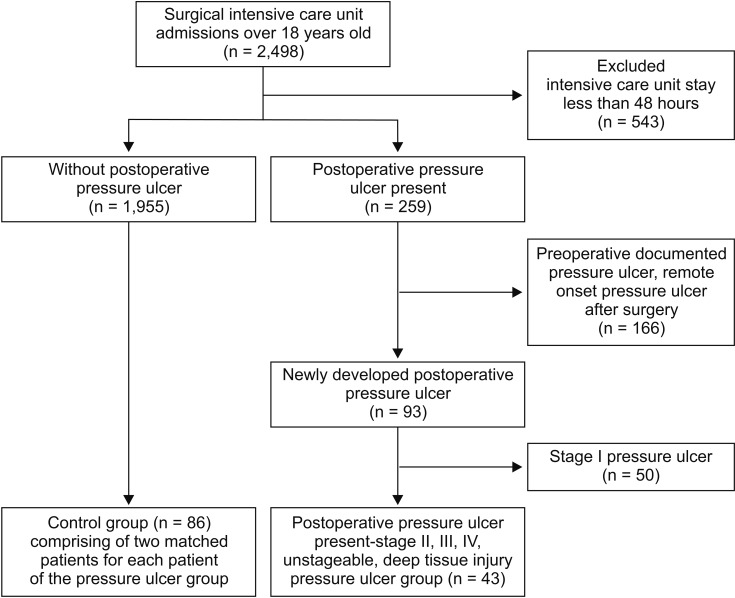
Methods: This retrospective case-control study evaluated 2,498 patients who underwent major surgery. Forty-three patients developed postoperative pressure ulcers and were matched to 86 control patients based on age, sex, surgery, and comorbidities.
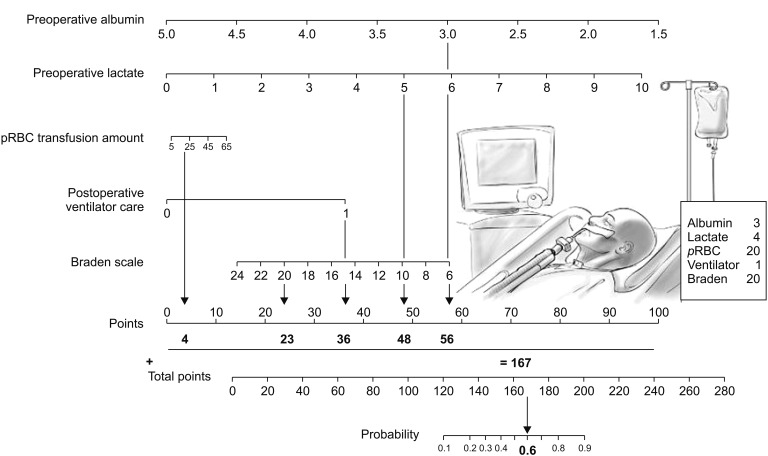
Results: The pressure ulcer group had lower baseline hemoglobin and albumin levels, compared to the control group. The pressure ulcer group also had higher values for lactate levels, blood loss, and number of packed red blood cell (pRBC) units. Univariate analysis revealed that pressure ulcer development was associated with preoperative hemoglobin levels, albumin levels, lactate levels, intraoperative blood loss, number of pRBC units, Acute Physiologic and Chronic Health Evaluation II score, Braden scale score, postoperative ventilator care, and patient restraint. In the multiple logistic regression analysis, only preoperative low albumin levels (odds ratio [OR]: 0.21, 95% CI: 0.05-0.82; P < 0.05) and high lactate levels (OR: 1.70, 95% CI: 1.07-2.71; P < 0.05) were independently associated with pressure ulcer development. A receiver operating characteristic curve was used to assess the predictive power of the logistic regression model, and the area under the curve was 0.88 (95% CI: 0.79-0.97; P < 0.001).
Conclusions: The present study revealed that preoperative low albumin levels and high lactate levels were significantly associated with pressure ulcer development after surgery.
Keywords: Albumin; Lactate; Perioperative risk factors; Pressure ulcer.
Figures

References
-
- Nilsson UG. Intraoperative positioning of patients under general anesthesia and the risk of postoperative pain and pressure ulcers. J Perianesth Nurs. 2013;28:137–143. - PubMed
-
- He W, Liu P, Chen HL. The Braden Scale cannot be used alone for assessing pressure ulcer risk in surgical patients: a meta-analysis. Ostomy Wound Manage. 2012;58:34–40. - PubMed
-
- O'Brien DD, Shanks AM, Talsma A, Brenner PS, Ramachandran SK. Intraoperative risk factors associated with postoperative pressure ulcers in critically ill patients: a retrospective observational study. Crit Care Med. 2014;42:40–47. - PubMed
-
- González-Ruiz JM, Sebastián-Viana T, Losa-Iglesias ME, Lema-Lorenzo I, Crespo FJ, Martín-Merino G, et al. Braden Scale and Norton Scale modified by INSALUD in an acute care hospital: validity and cutoff point. Adv Skin Wound Care. 2014;27:506–511. - PubMed
LinkOut - more resources
Full Text Sources
Other Literature Sources
Medical