. 2018 May;7(9):e1701393.
doi: 10.1002/adhm.201701393. Epub 2018 Feb 14.

Tough Composite Hydrogels with High Loading and Local Release of Biological Drugs

Affiliations

Tough Composite Hydrogels with High Loading and Local Release of Biological Drugs

Jianyu Li et al. Adv Healthc Mater. 2018 May.

Abstract

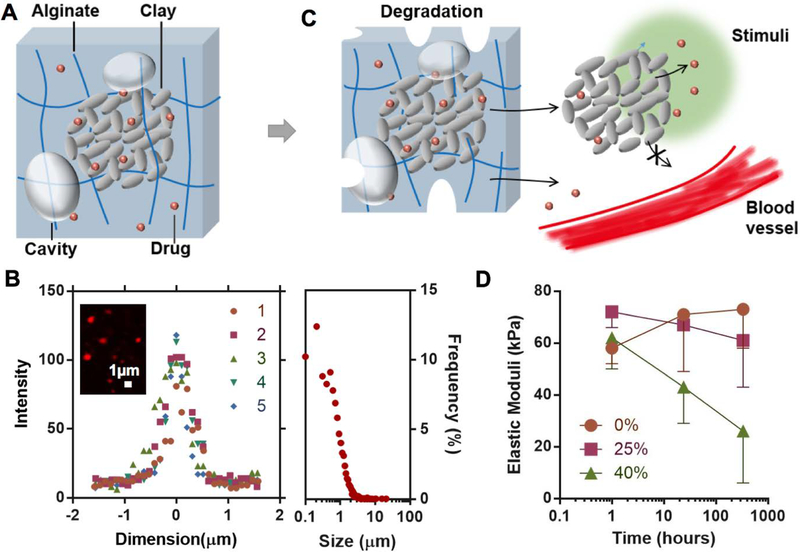
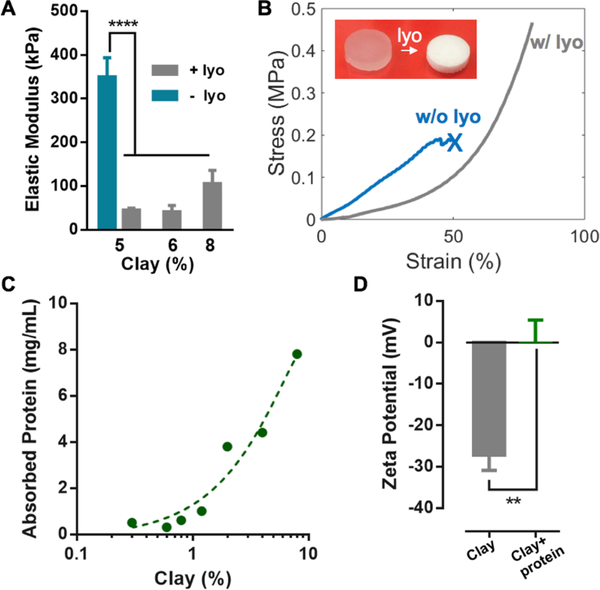
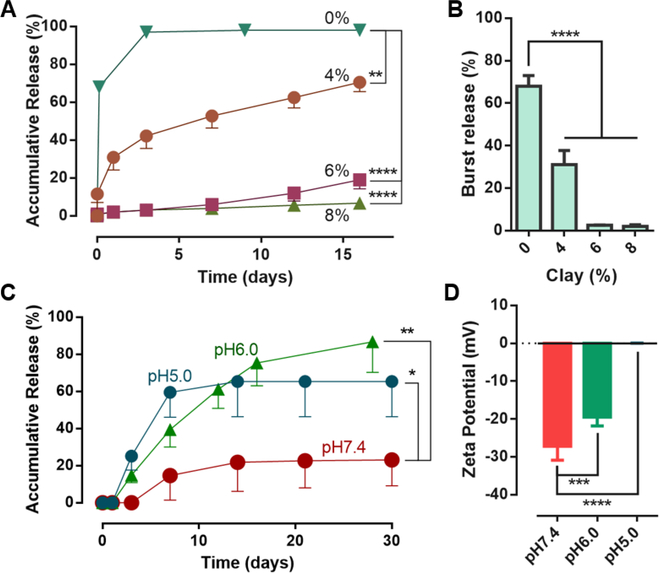
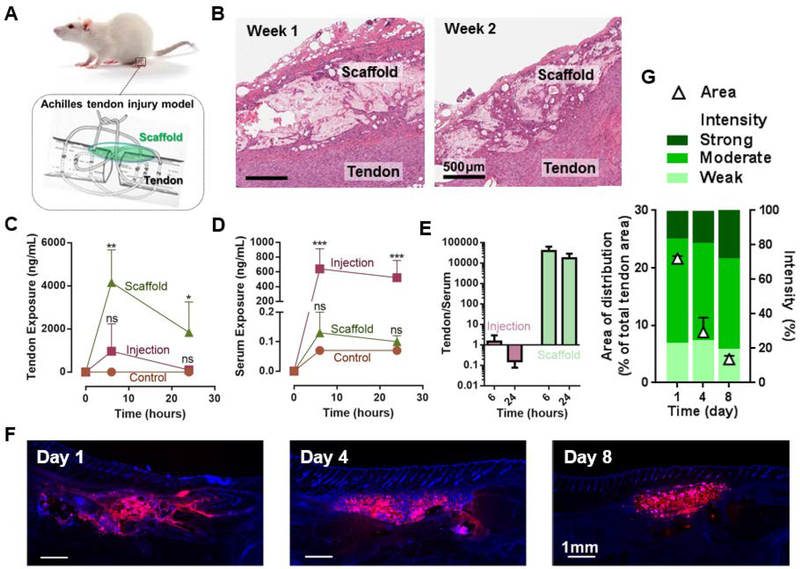
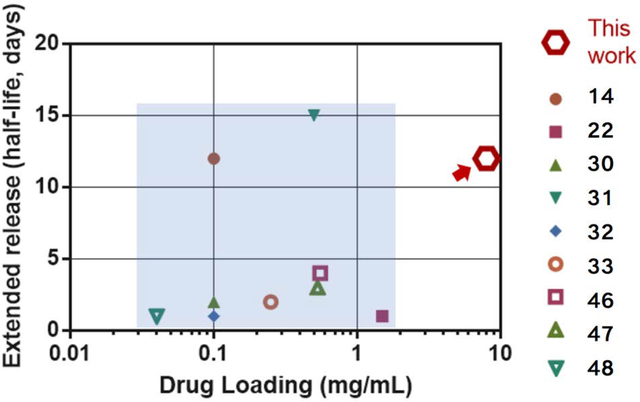
Hydrogels are under active development for controlled drug delivery, but their clinical translation is limited by low drug loading capacity, deficiencies in mechanical toughness and storage stability, and poor control over the drug release that often results in burst release and short release duration. This work reports a design of composite clay hydrogels, which simultaneously achieve a spectrum of mechanical, storage, and drug loading/releasing properties to address the critical needs from translational perspectives. The clay nanoparticles provide large surface areas to adsorb biological drugs, and assemble into microparticles that are physically trapped within and toughen hydrogel networks. The composite hydrogels demonstrate feasibility of storage, and extended release of large quantities of an insulin-like growth factor-1 mimetic protein (8 mg mL-1 ) over four weeks. The release rate is primarily governed by ionic exchange and can be upregulated by low pH, which is typical for injured tissues. A rodent model of Achilles tendon injury is used to demonstrate that the composite hydrogels allow for highly extended and localized release of biological drugs in vivo, while demonstrating biodegradation and biocompatibility. These attributes make the composite hydrogel a promising system for drug delivery and regenerative medicine.

Keywords: biological drugs; composite hydrogels; controlled delivery; regenerative medicine; tough hydrogels.


Figures

Figure 1.
Figure 1.
Design of composite hydrogels for controlled drug delivery. A) Clay microparticles formed by nanoparticles of Laponite (grey discs) adsorb drug molecules (red) and reside inside a biodegradable alginate network (blue lines) with micro-sized cavities (grey bubbles). The hydrogels also encapsulate some free drugs that are not associated with the clay. B) Representative intensity-dimension profiles of individual particles (Left; N=5 batches) and the population size distribution of the clay microparticles inside the composite hydrogels (Right; counted particles N=3882). The inset shows a confocal image of the clay nanoparticles and microparticles highlighted with Rhodamine-B. C) The alginate network degrades slowly over time, accompanied with the release of the clay microparticles, clay nanoparticles and free drug. Subject to localized stimuli like the change in pH (green region), the clay particles are expected to release most of the loaded drug locally without systemic exposure. D) Elastic moduli, as a metric for degradation of the composite hydrogels, as a function of time and the fraction of oxidized alginate in the hydrogels. Data represents the mean ±SD; N=3 per group.
Figure 2.
Figure 2.
Drug-loading and mechanical properties of the composite hydrogels. A) Elastic moduli of the composite hydrogels with different clay contents; the as-prepared hydrogels of 5% clay before lyophilization (blue bar) is included for comparison. Data represents the mean ±SD; N=3 per group. P values were determined by an ANOVA test; ****P≤0.0001. B) Compression stress-strain curves of the composite hydrogels (6% clay) before (w/o lyo) and after lyophilization (w/ lyo); the cross indicates gel rupture. The inset shows the composite hydrogels before and after lyophilization. C) Dependence of the IGF1 mimetic protein loading capacity on the clay content. The initial concentration of the protein was fixed at 8 mg/mL. D) Zeta potentials of the clay nanoparticles with and without adsorbed IGF1 mimetic protein. Data represents the mean ±SD; N=3 per group. P values were determined by a student t test; **P≤0.01.
Figure 3.
Figure 3.
In vitro drug-releasing properties. A) In vitro release profiles from the composite hydrogels with varying clay contents in cPBS medium of pH 7.4. B) Quantification of burst release measured by release within first 24 hours. C) Release profiles of composite hydrogels with 6% clay in release medium of varying pH. The ANOVA test was performed on the total amount of released drug. D) Zeta potentials of the clay nanoparticles at different pH. Data represents the mean ±SD; N=3 per group. P values were determined by ANOVA test; *P≤0.05; **P≤0.01; ***P≤0.001; ****P≤0.0001.
Figure 4.
Figure 4.
In vivo extended and localized drug release. A) The rat model of Achilles tenotomy and treatment with drug-releasing scaffolds (green). B) Images of H&E stained histological sections of scaffolds of the composite hydrogel 1 week and 2 weeks after implantation on top of the site of Achilles tendon injury. C,D) IGF1 mimetic protein exposure to Achilles tendon (C) and to serum (D) as a function of time. Bolus injection of the same protein quantity (Injection), and injection of saline (Control) are included for comparison. Data represents the mean ±SD; N=4 per group. P values were determined by ANOVA tests; *P≤0.05; **P≤0.01; ***P≤0.001; ns, not significant. E) Ratio of the protein exposure in Achilles tendon to serum resulting from bolus injection and composite hydrogels at 6 and 24 hours. F) Fluorescent images of histological sections from explanted tissues with DAPI staining (blue) to examine the distribution of the fluorescein-labeled protein (red) in vivo over time. G) Area of distribution of the IGF1 mimetic protein (triangles) and fluorescence signal intensity over time of the IGF1 positive area (graded as Strong, Moderate, Weak protein signal). Data represents the mean ±SD; N=2 per group.
Figure 5.
Figure 5.
Comparison of drug loading capacity and extended releasing properties of the composite hydrogels and other hydrogel delivery systems. The extended release is quantified by the time at which 50% of the loaded drug is released. The composite hydrogels (marked with red arrow) outperform existing hydrogel delivery systems (light blue area) in terms of drug loading and extended releasing properties. The reference number for each data point is as labeled (14,22,30–33,46–48).

References

    1. Langer R, Nature 1998, 392, 5. - PubMed
    1. BBC, Global markets for bioengineered protein drugs. BBC Res. 2014.
    1. Mitragotri S, Burke PA, Langer R, Nat. Rev. Drug Discov 2014, 13, 655. - PMC - PubMed
    1. Pakulska MM, Miersch S, Shoichet MS, Science 2016, 351, aac4750. - PubMed
    1. Censi R, Di P, Vermonden T, Hennink WE, Chem. Rev 2012, 161, 680. - PubMed

Publication types

MeSH terms

LinkOut - more resources