

Utilization, Spending, and Price Trends for Quinolones in the US Medicaid Programs: 25 Years' Experience 1991-2015
- PMID: 29442334
- PMCID: PMC5691846
- DOI: 10.1007/s41669-016-0007-y
Utilization, Spending, and Price Trends for Quinolones in the US Medicaid Programs: 25 Years' Experience 1991-2015
Abstract
Background: Given that the quinolones is one of the antibacterial classes most frequently used to treat patients with bacterial infections in the United States, any change in prescribing patterns of quinolones will impact Medicaid medical expenditures.
Objectives: This study was undertaken to examine trends in utilization, reimbursement, and prices of quinolone antibacterials for the US Medicaid population.
Methods: The publicly available Medicaid State Drug Utilization outpatient pharmacy files were used for this study. Quarterly and annual prescription counts and reimbursement amounts were calculated for each of the quinolones reimbursed by Medicaid from quarter 1, 1991 through quarter 2, 2015. Average per-prescription reimbursement, as a proxy for drug price, was calculated as the drug reimbursement divided by the number of prescriptions.
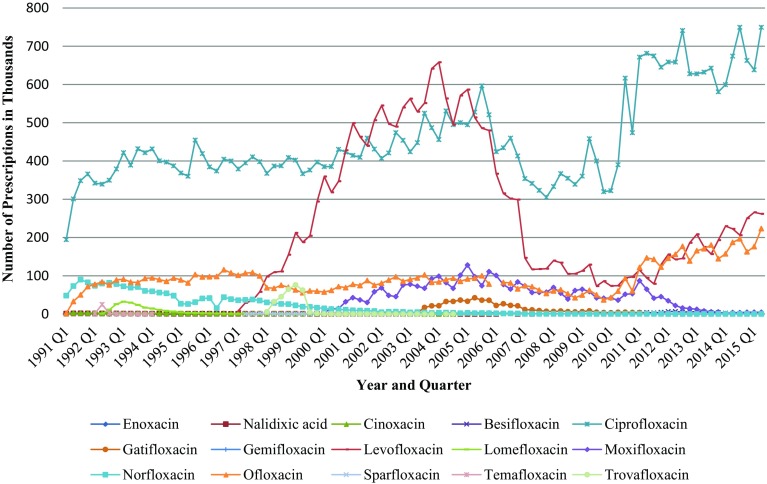
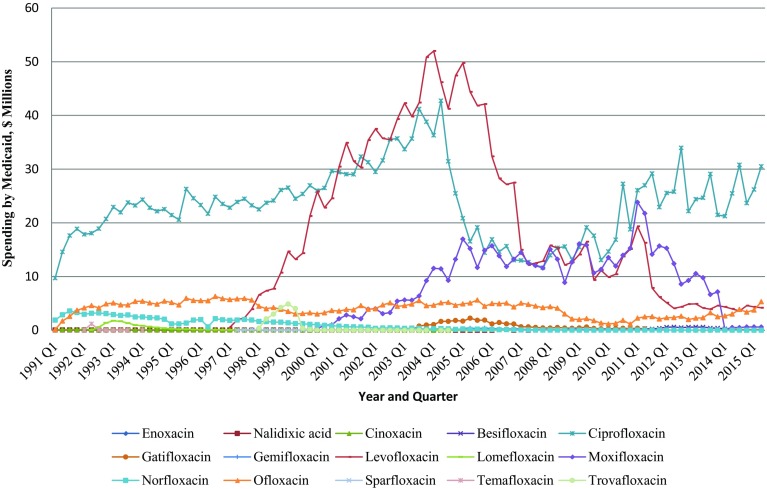
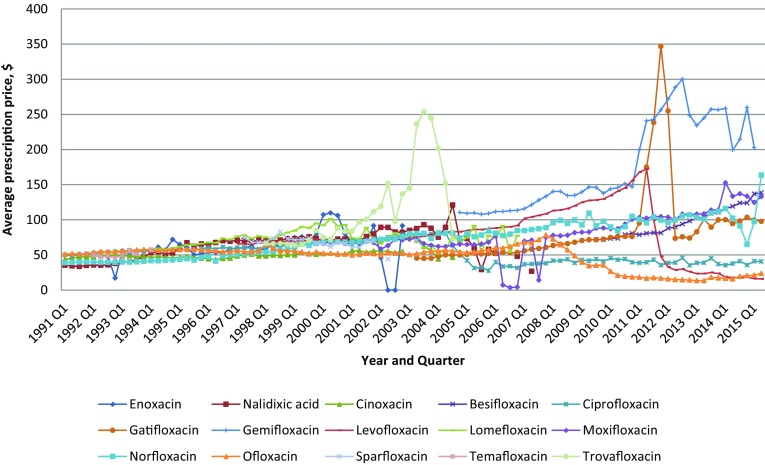
Results: The total annual number of quinolone prescriptions increased 402%, from 247,395 in the first quarter of 1991 to 1.2 million in the second quarter of 2015, peaking at 1.3 million in the first quarter of 2005. Similarly, the total reimbursement for quinolone agents increased by 245.5% over the same period. More than 80% of quinolone prescriptions reimbursed by Medicaid were for the second-generation agent, ciprofloxacin, and the third-generation agent, levofloxacin. The average payment per prescription for quinolones increased from US$43.8 in the first quarter of 1991 to US$87.6 in the second quarter of 2015.
Conclusions: A substantial rise in Medicaid expenditures on quinolones was observed during the 25-year study period, which was mainly because of rising utilization. Therefore, there is a need for additional research that has access to clinically relevant data with which to measure the rate of inappropriate quinolone use among the Medicaid population and associated clinical outcomes and healthcare costs.
Keywords: Gatifloxacin; Levofloxacin; Ofloxacin; Quinolone; Trovafloxacin.
Conflict of interest statement
Data availability statement
The datasets analyzed during the current study are publicly available from Centers for Medicare & Medicaid Services at
Funding
This research did not receive any specific grant from funding agencies in the public, commercial, or not-for-profit sectors.
Conflict of interest
The authors Ziyad S. Almalki, Xiaomeng Yue, Ying Xia, Patricia R. Wigle, and Jeff Jianfei Guo have indicated that they have no conflicts of interest with regard to the content of this article.
Author contributions
ZSA carried out the literature review, statistical analyses, manuscript drafting, manuscript editing, and manuscript revision. XY carried out the study design, statistical analyses, and manuscript revision. YX participated in data collection, statistical analyses, and manuscript editing. PRW participated in manuscript editing and manuscript revision. JJG participated in study design and data collection, manuscript editing, manuscript revision, and coordination. All authors read and approved the final manuscript.
Figures
References
-
- Nett RJ, et al. Office-related antibiotic prescribing for Medicaid-enrolled children. Clin Pediatr: 0009922813479158 (2013). - PubMed
-
- Berman S, et al. Otitis media-related antibiotic prescribing patterns, outcomes, and expenditures in a pediatric Medicaid population. Pediatrics.1997;100.4: 585–592. - PubMed
LinkOut - more resources
Full Text Sources
Other Literature Sources
