. 2018 Mar 6;90(5):3592-3599.
doi: 10.1021/acs.analchem.8b00041. Epub 2018 Feb 22.

Dual-Color Bioluminescent Sensor Proteins for Therapeutic Drug Monitoring of Antitumor Antibodies

Affiliations

Dual-Color Bioluminescent Sensor Proteins for Therapeutic Drug Monitoring of Antitumor Antibodies

Martijn van Rosmalen et al. Anal Chem. .

Abstract

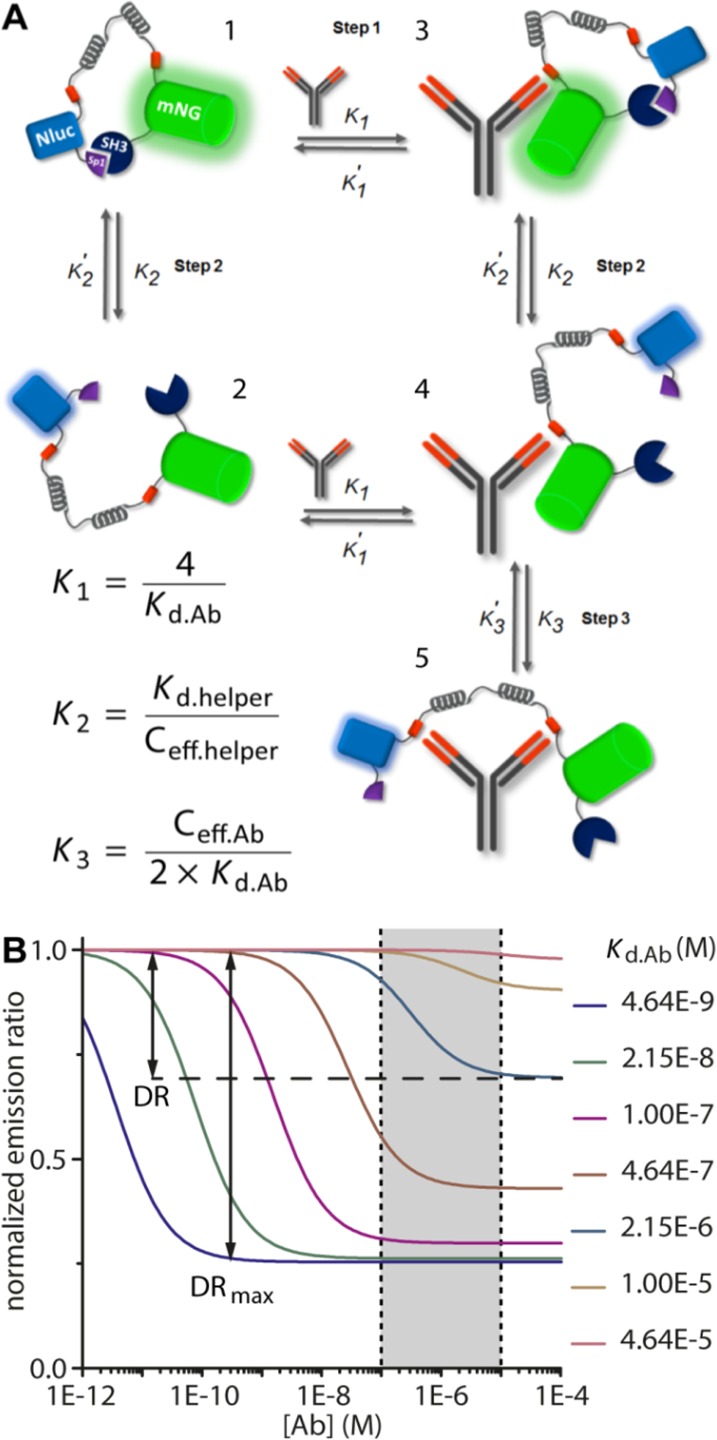
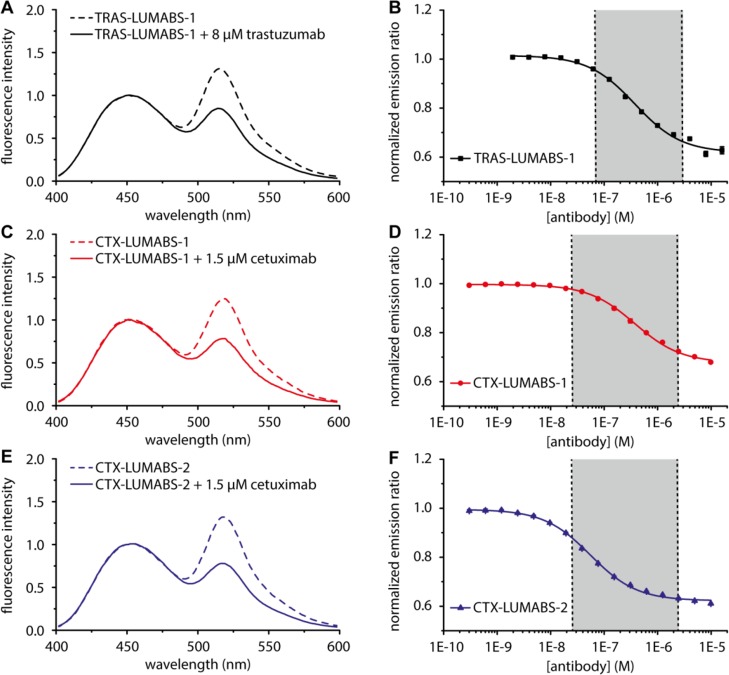
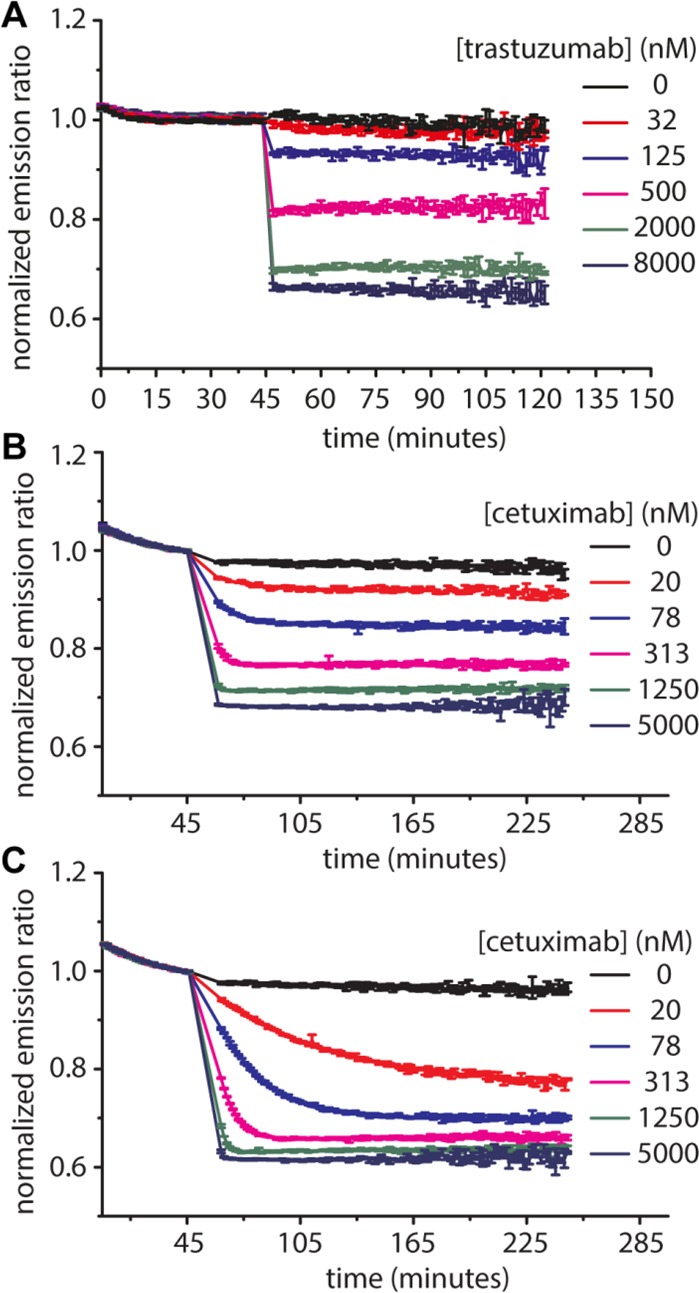
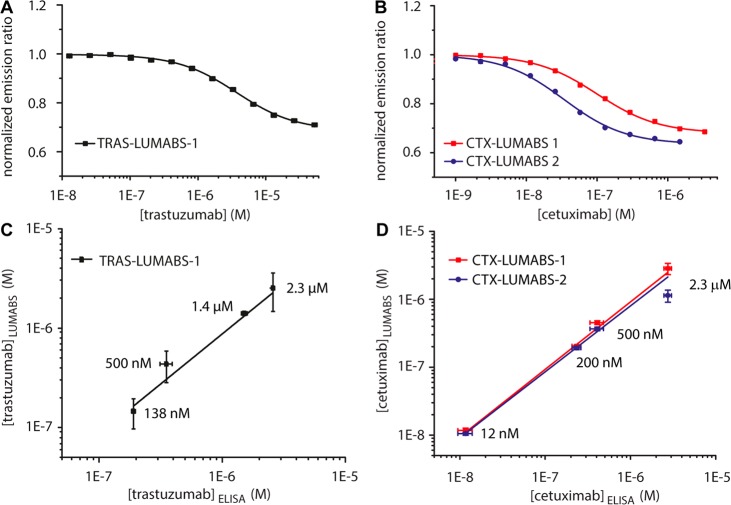
Monitoring the levels of therapeutic antibodies in individual patients would allow patient-specific dose optimization, with the potential for major therapeutic and financial benefits. Our group recently developed a new platform of bioluminescent sensor proteins (LUMABS; LUMinescent AntiBody Sensor) that allow antibody detection directly in blood plasma. In this study, we targeted four clinically important therapeutic antibodies, the Her2-receptor targeting trastuzumab, the anti-CD20 antibodies rituximab and obinutuzumab, and the EGFR-blocking cetuximab. A strong correlation was found between the affinity of the antibody binding peptide and sensor performance. LUMABS sensors with physiologically relevant affinities and decent sensor responses were obtained for trastuzumab and cetuximab using mimotope and meditope peptides, respectively, with affinities in the 10-7 M range. The lower affinity of the CD20-derived cyclic peptide employed in the anti-CD20 LUMABS sensor ( Kd = 10-5 M), translated in a LUMABS sensor with a strongly attenuated sensor response. The trastuzumab and cetuximab sensors were further characterized with respect to binding kinetics and their performance in undiluted blood plasma. For both antibodies, LUMABS-based detection directly in plasma compared well to the analytical performance of commercial ELISA kits. Besides identifying important design parameters for the development of new LUMABS sensors, this work demonstrates the potential of the LUMABS platform for point-of-care detection of therapeutic antibodies.


Conflict of interest statement

The authors declare no competing financial interest.

Figures

Figure 1
Figure 1
Thermodynamic model of LUMABS sensor mechanism. (A) Different states accessible to the sensor in the absence or presence of antibody. (B) Predicted response curves for sensors with epitopes of different Kd.Ab and a Ceff.helper/Ceff.Ab ratio of 10 (see Supporting Information for the exact parameters used). The gray area between dashed lines represents the global concentration range of therapeutic antibodies in patient serum. DR = dynamic range.
Figure 2
Figure 2
Characterization of LUMABS assays for the detection of trastuzumab and cetuximab. (A,C,E) Luminescence emission spectra of 100 pM TRAS-LUMABS-1 (A) CTX-LUMABS-1 (C) or CTX-LUMABS-2 (E) with or without the indicated amount of the target antibody and normalized at 460 nm. (B,D,F) Antibody titrations to 100 pM of TRAS-LUMABS-1 (B) CTX-LUMABS-1 (D) or CTX-LUMABS-2 (F). Data represent mean ± SD from triplicate measurements.
Figure 3
Figure 3
Kinetics of TRAS-LUMABS and CTX-LUMABS sensors. Green/blue luminescence emission ratio was monitored at 100 pM of TRAS-LUMABS-1 (A), CTX-LUMABS-1 (B) or CTX-LUMABS-2 (C) in 50 μL of luminescence buffer and a NanoGlo substrate dilution of 1000×. Error bars represent mean ± SD of triplicate measurements. Data were normalized to the average ratio of the last 10 data before antibody addition.
Figure 4
Figure 4
Performance of TRAS-LUMABS and CTX-LUMABS assays in blood plasma. (A,B) Calibration of TRAS-LUMABS-1 (A) and CTX-LUMABS-1 and -2 (B) in 90% plasma. Error bars represent mean ± SD from three measurements of the same calibration sample. (C,D) Correlation of antibody concentrations measured by ELISA and by TRAS-LUMABS-1 (C) or CTX-LUMABS-1 and -2 (D). Concentrations were calculated from each measurement using the calibration curve. Error bars represent mean ± SD of these concentrations.

References

    1. Rodgers K. R.; Chou R. C. Biotechnol. Adv. 2016, 34, 1149–1158. 10.1016/j.biotechadv.2016.07.004. - DOI - PubMed
    1. Batra S. K.; Jain M.; Wittel U. A.; Chauhan S. C.; Colcher D. Curr. Opin. Biotechnol. 2002, 13, 603–608. 10.1016/S0958-1669(02)00352-X. - DOI - PubMed
    1. Roskos L. K.; Davis C. G.; Schwab G. M. Drug Dev. Res. 2004, 61, 108–120. 10.1002/ddr.10346. - DOI
    1. Ma P.; Yang B.-B.; Wang Y.-M.; Peterson M.; Narayanan A.; Sutjandra L.; Rodriguez R.; Chow A. J. Clin. Pharmacol. 2009, 49, 1142–1156. 10.1177/0091270009344989. - DOI - PubMed
    1. Gill K. L.; Machavaram K. K.; Rose R. H.; Chetty M. Clin. Pharmacokinet. 2016, 55, 789–805. 10.1007/s40262-015-0361-4. - DOI - PubMed

Publication types