

Assessment of interchangeability rate between 2 methods of measurements: An example with a cardiac output comparison study
- PMID: 29443764
- PMCID: PMC5839816
- DOI: 10.1097/MD.0000000000009905
Assessment of interchangeability rate between 2 methods of measurements: An example with a cardiac output comparison study
Abstract
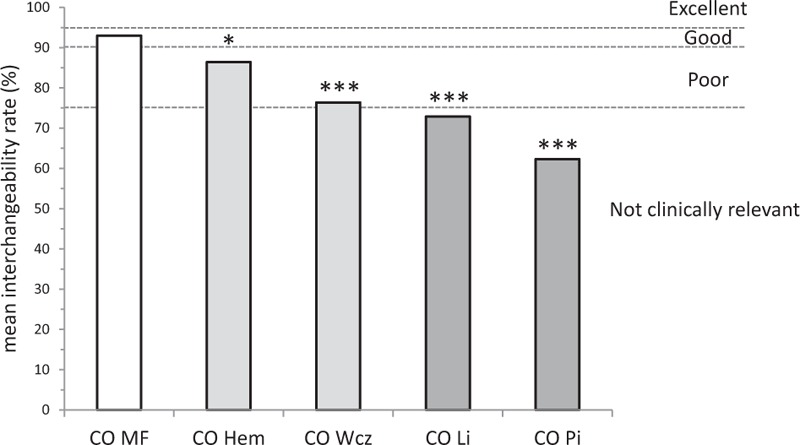
The Bland-Altman (BA) and percentage error (PE) methods have been previously described to assess the agreement between 2 methods of medical or laboratory measurements. This type of approach raises several problems: the BA methodology constitutes a subjective approach to interchangeability, whereas the PE approach does not take into account the distribution of values over a range. We describe a new methodology that defines an interchangeability rate between 2 methods of measurement and cutoff values that determine the range of interchangeable values. We used a simulated data and a previously published data set to demonstrate the concept of the method. The interchangeability rate of 5 different cardiac output (CO) pulse contour techniques (Wesseling method, LiDCO, PiCCO, Hemac method, and Modelflow) was calculated, in comparison with the reference pulmonary artery thermodilution CO using our new method. In our example, Modelflow with a good interchangeability rate of 93% and a cutoff value of 4.8 L min, was found to be interchangeable with the thermodilution method for >95% of measurements. Modelflow had a higher interchangeability rate compared to Hemac (93% vs 86%; P = .022) or other monitors (Wesseling cZ = 76%, LiDCO = 73%, and PiCCO = 62%; P < .0001). Simulated data and reanalysis of a data set comparing 5 CO monitors against thermodilution CO showed that, depending on the repeatability of the reference method, the interchangeability rate combined with a cutoff value could be used to define the range of values over which interchangeability remains acceptable.
Conflict of interest statement
The authors declare no conflict of interest.
Figures
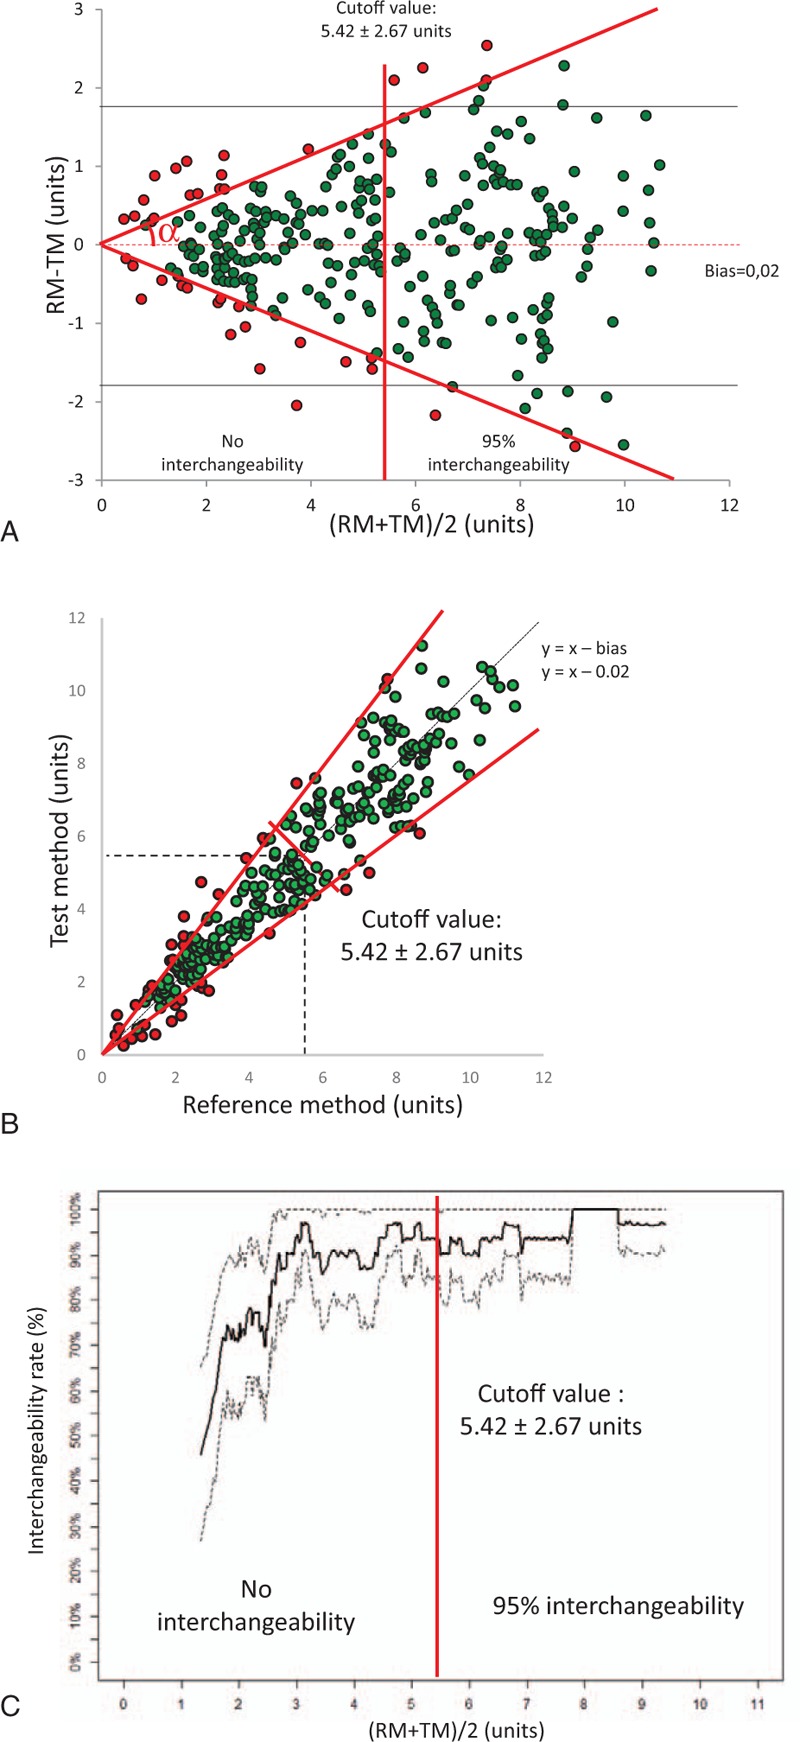
 ) (red line) and the cutoff of interchangeability (using the calculated cutoff value = 5.42 ± 2.67 units). Interchangeable points and non-interchangeable points are depicted in green or red, respectively (N = 297 simulated data points). (B) Correlation graphical representation. The line of equality minus the bias (dark line) is completed by the angular sector β (red line) and the line of interchangeability and by the cutoff of interchangeability (red line [using the calculated cutoff value = 5.42 ± 2.67 units]). (C) Ranged based interchangeability rate according to the range. The cutoff of the interchangeability line is shown in red (using the calculated cutoff value = 5.42 ± 2.67 units).
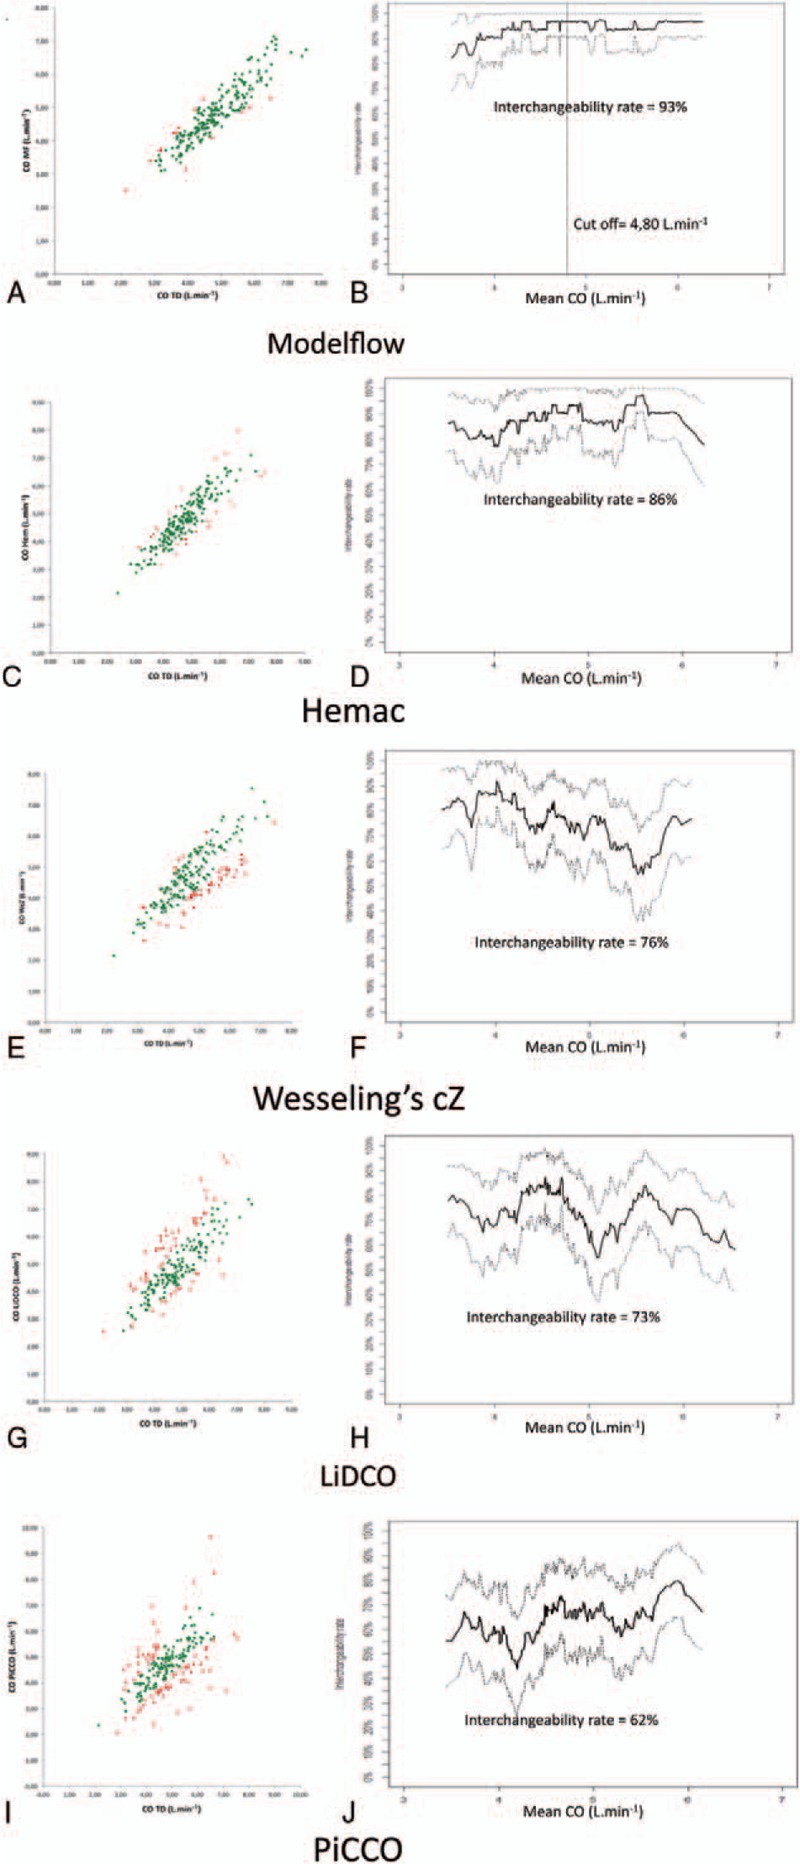
References
-
- Bland JM, Altman DG. Statistical methods for assessing agreement between two methods of clinical measurement. Lancet 1986;1:307–10. - PubMed
-
- Critchley LA, Critchley JA. A meta-analysis of studies using bias and precision statistics to compare cardiac output measurement techniques. J Clin Monit Comput 1999;15:85–91. - PubMed
-
- Joosten A, Desebbe O, Suehiro K, et al. Accuracy and precision of non-invasive cardiac output monitoring devices in perioperative medicine: a systematic review and meta-analysis†. Br J Anaesth 2017;118:298–310. - PubMed
-
- Hamilton MA, Cecconi M, Rhodes A. A systematic review and meta-analysis on the use of preemptive hemodynamic intervention to improve postoperative outcomes in moderate and high-risk surgical patients. Anesth Analg 2011;112:1392–402. - PubMed
-
- Soni N. British Consensus Guidelines on Intravenous Fluid Therapy for Adult Surgical Patients (GIFTASUP): Cassandra's view. Anaesthesia 2009;64:235–8. - PubMed
Publication types
MeSH terms
LinkOut - more resources
Full Text Sources
Other Literature Sources
Molecular Biology Databases
