. 2018 Feb 14;13(2):e0192472.
doi: 10.1371/journal.pone.0192472. eCollection 2018.

A long-term mechanistic computational model of physiological factors driving the onset of type 2 diabetes in an individual

Affiliations

A long-term mechanistic computational model of physiological factors driving the onset of type 2 diabetes in an individual

Joydeep Sarkar et al. PLoS One. .

Abstract

A computational model of the physiological mechanisms driving an individual's health towards onset of type 2 diabetes (T2D) is described, calibrated and validated using data from the Diabetes Prevention Program (DPP). The objective of this model is to quantify the factors that can be used for prevention of T2D. The model is energy and mass balanced and continuously simulates trajectories of variables including body weight components, fasting plasma glucose, insulin, and glycosylated hemoglobin among others on the time-scale of years. Modeled mechanisms include dynamic representations of intracellular insulin resistance, pancreatic beta-cell insulin production, oxidation of macronutrients, ketogenesis, effects of inflammation and reactive oxygen species, and conversion between stored and activated metabolic species, with body-weight connected to mass and energy balance. The model was calibrated to 331 placebo and 315 lifestyle-intervention DPP subjects, and one year forecasts of all individuals were generated. Predicted population mean errors were less than or of the same magnitude as clinical measurement error; mean forecast errors for weight and HbA1c were ~5%, supporting predictive capabilities of the model. Validation of lifestyle-intervention prediction is demonstrated by synthetically imposing diet and physical activity changes on DPP placebo subjects. Using subject level parameters, comparisons were made between exogenous and endogenous characteristics of subjects who progressed toward T2D (HbA1c > 6.5) over the course of the DPP study to those who did not. The comparison revealed significant differences in diets and pancreatic sensitivity to hyperglycemia but not in propensity to develop insulin resistance. A computational experiment was performed to explore relative contributions of exogenous versus endogenous factors between these groups. Translational uses to applications in public health and personalized healthcare are discussed.


Conflict of interest statement

Competing Interests: All authors were employees of PricewaterhouseCoopers, LLP during the time this research was conducted with no competing interests. This does not alter our adherence to PLOS ONE policies on sharing data and materials. PricewaterhouseCoopers, LLP has applied for a patent on the model described in manuscript, Title of Invention: System and Method for Physiological Health Simulation EFS ID: 25458847 Application Number: 15096022 This patent does not alter our adherence to PLOS ONE policies on sharing data and materials. This patent does not prevent others from reproducing the work and meets PLoS One’s requirements for making regents/software/data available.

Figures

Fig 1
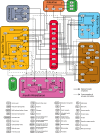
Fig 1. Schematic diagram of model components.
Model compartments, internal component processes, flow of chemical species and metabolic information, and definitions of model variables.
Fig 2
Fig 2. Baseline 3 year model simulation under increased diet intervention.
2A: Body mass index (BMI); 2B: Weight; 2C: Fat mass; 2D: Fat free mass; 2E: Glycogen; 2F: Serum free fatty acid (FFA); 2G: Glucose; 2H: HbA1c; 2I: Insulin; 2J: Insulin sensitivity; 2K: Number of beta cells; 2L: Beta cell damage.
Fig 3
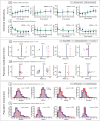
Fig 3. Results of model calibration to DPP placebo and lifestyle-intervention subjects.
3A: Example of model calibration to individual placebo subject (data: black dots, standard measurement error: blue bars, model simulation: green line); 3B: Example of model calibration to individual lifestyle-intervention subject (data: black dots, standard measurement error: blue bars, model simulation: green line); 3C: Scatterplot of placebo population calibration errors (individual subjects: dots, population mean error: blue line, standard measurement error: red dash line); 3D: Scatterplot of lifestyle-intervention population calibration errors (individual subjects: dots, population mean error: blue line, standard measurement error: red dash line); 3E: Simulated placebo population (blue) compared to placebo arm population (pink) at year three of the DPP study; 3F: Simulated lifestyle-intervention population (blue) compared to lifestyle-intervention arm population (pink) at year three of the DPP study.
Fig 4
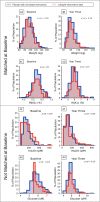
Fig 4. Comparison of simulated placebo intervention and observed lifestyle-intervention groups.
4A: Simulated placebo intervention (blue) and lifestyle-intervention (pink) populations weight at DPP study baseline; 4B: Simulated placebo intervention (blue) and lifestyle-intervention (pink) populations weight at DPP study year three; 4C: Simulated placebo intervention (blue) and lifestyle-intervention (pink) populations HbA1c at DPP study baseline; 4D: Simulated placebo intervention (blue) and lifestyle-intervention (pink) populations HbA1c at DPP study year three.
Fig 5
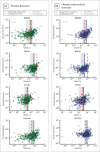
Fig 5. One year forecasts of placebo and lifestyle-intervention arm subjects.
5A: Forecast of placebo year three clinical data (individual errors: green dots, mean population error: green line, standard measurement error (red dashed line); 5B: Forecast of lifestyle-intervention year three clinical data (individual errors: green dots, mean population error: green line, standard measurement error (red dashed line).
Fig 6
Fig 6. Results of the computational experiment on DPP placebo first (Q1) and fourth (Q4) quartiles of change in HbA1c over first three years.
6A: Distributions of HbA1c for Q1 (blue) and Q4 (green) at DPP baseline study start; 6B: Distributions of HbA1c for Q1 (blue) and Q4 (green) at year three of the DPP study; 6C: Distribution of change in HbA1c of Q1 subjects data at year three of the DPP study; 6D: Distribution of change in HbA1c of Q4 subjects data at year three of the DPP study; 6E: Distribution of change in HbA1c of Q1 subjects simulated with the mean Q4 diet at year three of the DPP study; 6F: Distribution of change in HbA1c of Q4 subjects simulated with the mean Q1 diet at year three of the DPP study.

References

    1. Centers for Disease Control and Prevention. National Diabetes Statistics Report, 2014 Estimates of Diabetes and Its Burden in the Epidemiologic estimation methods. US Department of Health and Human Services; 2014.
    1. Centers for Disease Control and Prevention. Diabetes Report Card 2014. Atlanta, GA; 2014.
    1. Kannel WB, Castelli WP, McNamara PM, McKee PA, Feinleib M. Role of Blood Pressure in the Development of Congestive Heart Failure. N Engl J Med. Massachusetts Medical Society; 1972;287: 781–787. doi: 10.1056/NEJM197210192871601 - DOI - PubMed
    1. Tuttolomondo A, Pinto A, Salemi G, Di Raimondo D, Di Sciacca R, Fernandez P, et al. Diabetic and non-diabetic subjects with ischemic stroke: Differences, subtype distribution and outcome. Nutr Metab Cardiovasc Dis. 2008;18: 152–157. doi: 10.1016/j.numecd.2007.02.003 - DOI - PubMed
    1. Bild DE, Selby J V, Sinnock P, Browner WS, Braveman P, Showstack JA. Lower-Extremity Amputation in People With Diabetes: Epidemiology and Prevention. Diabetes Care. 1989;12. - PubMed

Publication types

LinkOut - more resources