. 2018 Jul 1;34(13):2177-2184.
doi: 10.1093/bioinformatics/bty078.

Hierarchical analysis of RNA-seq reads improves the accuracy of allele-specific expression

Affiliations

Hierarchical analysis of RNA-seq reads improves the accuracy of allele-specific expression

Narayanan Raghupathy et al. Bioinformatics. .

Abstract

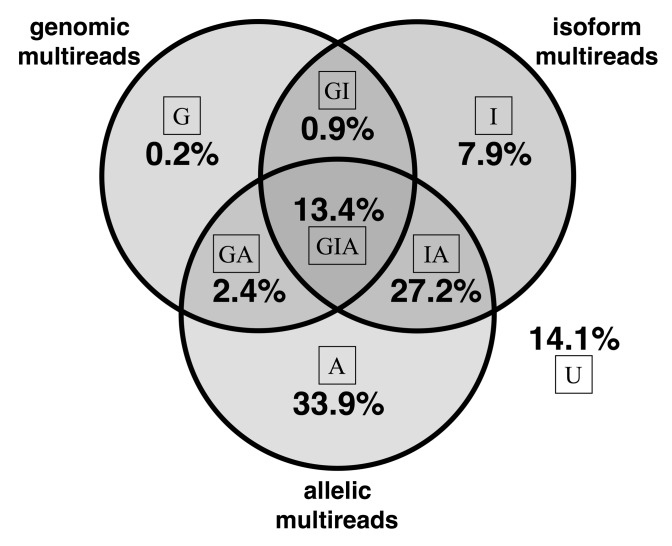
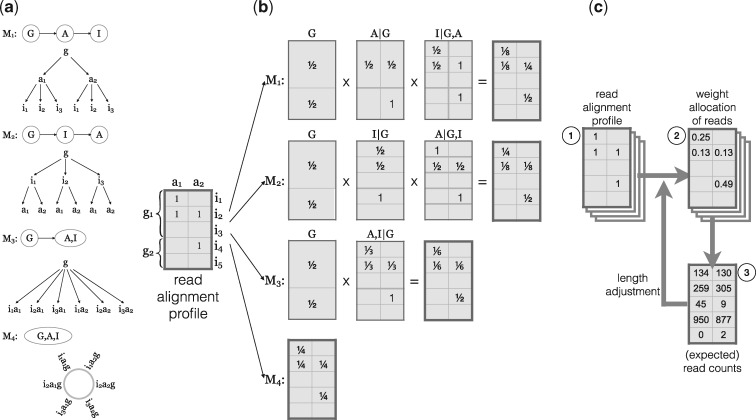
Motivation: Allele-specific expression (ASE) refers to the differential abundance of the allelic copies of a transcript. RNA sequencing (RNA-seq) can provide quantitative estimates of ASE for genes with transcribed polymorphisms. When short-read sequences are aligned to a diploid transcriptome, read-mapping ambiguities confound our ability to directly count reads. Multi-mapping reads aligning equally well to multiple genomic locations, isoforms or alleles can comprise the majority (>85%) of reads. Discarding them can result in biases and substantial loss of information. Methods have been developed that use weighted allocation of read counts but these methods treat the different types of multi-reads equivalently. We propose a hierarchical approach to allocation of read counts that first resolves ambiguities among genes, then among isoforms, and lastly between alleles. We have implemented our model in EMASE software (Expectation-Maximization for Allele Specific Expression) to estimate total gene expression, isoform usage and ASE based on this hierarchical allocation.

Results: Methods that align RNA-seq reads to a diploid transcriptome incorporating known genetic variants improve estimates of ASE and total gene expression compared to methods that use reference genome alignments. Weighted allocation methods outperform methods that discard multi-reads. Hierarchical allocation of reads improves estimation of ASE even when data are simulated from a non-hierarchical model. Analysis of RNA-seq data from F1 hybrid mice using EMASE reveals widespread ASE associated with cis-acting polymorphisms and a small number of parent-of-origin effects.

Availability and implementation: EMASE software is available at https://github.com/churchill-lab/emase.

Supplementary information: Supplementary data are available at Bioinformatics online.


Figures

Fig. 1.
Fig. 1.
Multi-read proportions in hybrid mouse data. For each read, we determined whether it aligns to multiple genomic locations, multiple isoforms of a gene and multiple alleles. If, for example, a read is a genomic multi-read and is also an isoform multi-read for at least one of its genomic alignments, the read is counted as an isoform multi-read. Complex multi-reads are shown at the intersections of the Venn diagram. The proportion of reads that align uniquely at all levels is 14.1% as shown
Fig. 2.
Fig. 2.
Hierarchical allocation of multi-reads. (a) The EMASE model hierarchies are illustrated for a gene (g) with two alleles (a1,a2) and three isoforms (i1,i2,i3). The model hierarchy determines the order in which the alignments of a multi-read are resolved. For example, under EMASE model 1 (M1), we first account for genomic multi-read alignments, then allele alignments and isoform alignments are last to be resolved. Under EMASE model 4 (M4), all alignments of a multi-read are treated equally and are resolved without any order. (b) Probabilistic allocation of a complex multi-read. The alignment profile (left) is an indicator matrix with ‘1’ set at the aligned positions of a multi-read in a diploid transcriptome. Dark gray lines indicate levels of hierarchy within which weights are being allocated. Light gray lines distinguish items in each level of hierarchy. In EMASE, a multi-read is allocated along four different hierarchies. For example, in M1 a read with the given alignment profile is sequentially allocated at the level of gene, then allele and finally isoform. Note that for models M1, M2 and M3, the presence of three alignments to gene g1 is counted as a single event and thus the weight allocated to each gene is 12. Under M4, each alignment is weighted equally; gene g1 receives 34 of the total weight and gene g2 receives 14. (c) The EMASE parameter estimation algorithm is carried out iteratively. Each read alignment profile (1) is assigned weights in proportion to the current estimates of transcript proportion (2). Then weights are summed to obtain the expected read counts (3). Counts are normalized by their effective transcript length to obtain new estimates of transcript proportions. This cycle is repeated until the transcript proportion parameters converge

References

    1. Agresti A. (2002). Categorical Data Analysis. Wiley Series in Probability and Statistics, 2nd edn. Wiley-Interscience, New York.
    1. Baker C.L. et al. (2015) PRDM9 drives evolutionary erosion of hotspots in Mus musculus through haplotype-specific initiation of meiotic recombination. PLoS Genet., 11, e1004916.. - PMC - PubMed
    1. Bray N.L. et al. (2016) Near-optimal probabilistic RNA-seq quantification. Nat. Biotechnol., 34, 525–527. - PubMed
    1. Castel S.E. et al. (2015) Tools and best practices for data processing in allelic expression analysis. Genome Biol., 16, 195.. - PMC - PubMed
    1. Chick J.M. et al. (2016) Defining the consequences of genetic variation on a proteome-wide scale. Nature, 534, 500–505. - PMC - PubMed

Publication types