. 2018 Mar 1;94(3):fiy025.
doi: 10.1093/femsec/fiy025.

Ice algal bloom development on the surface of the Greenland Ice Sheet

Affiliations

Ice algal bloom development on the surface of the Greenland Ice Sheet

C J Williamson et al. FEMS Microbiol Ecol. .

Abstract

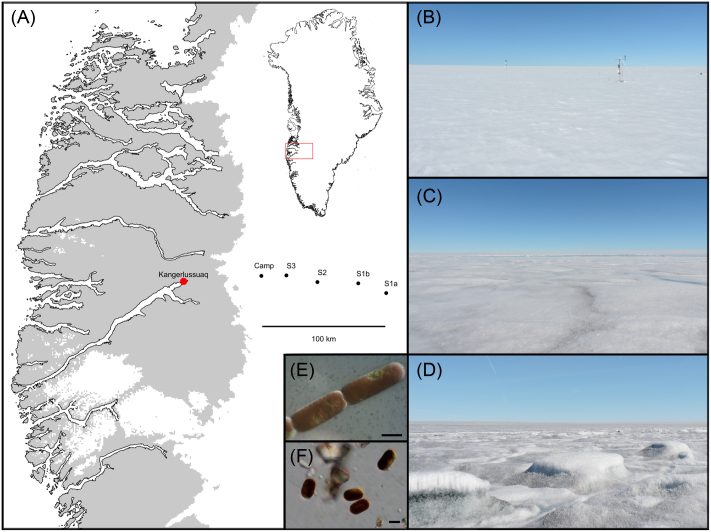
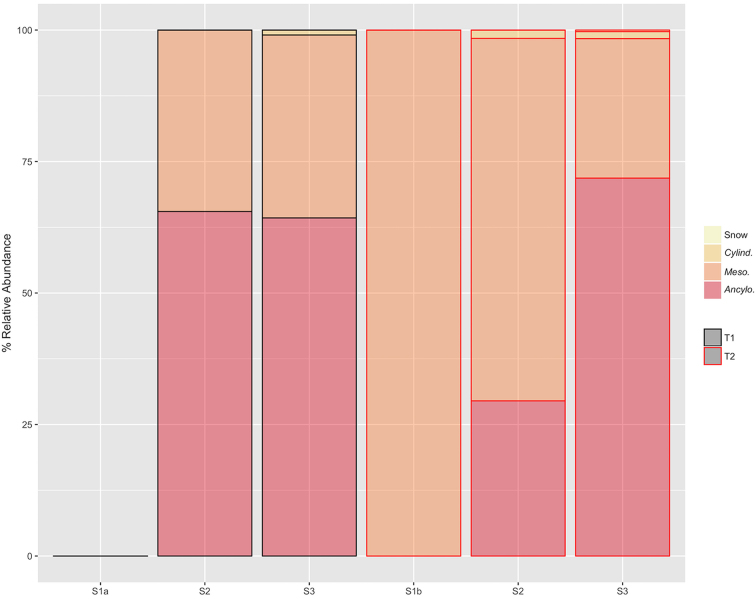
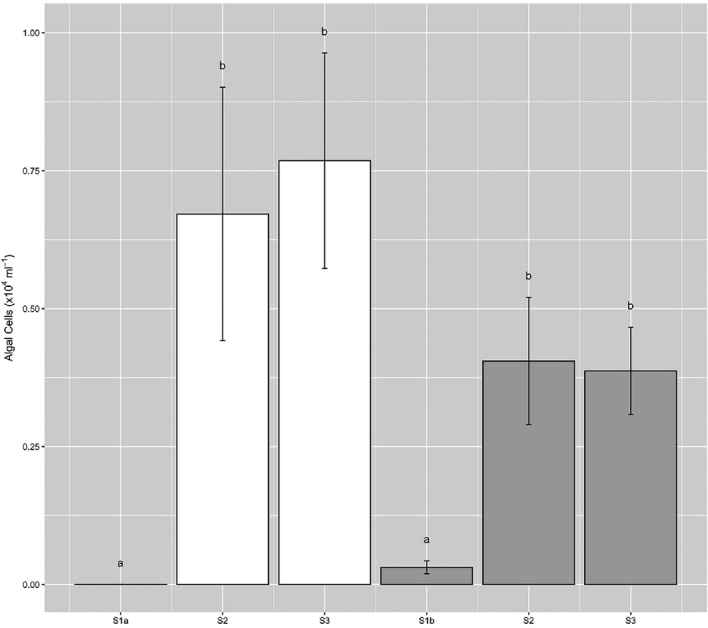
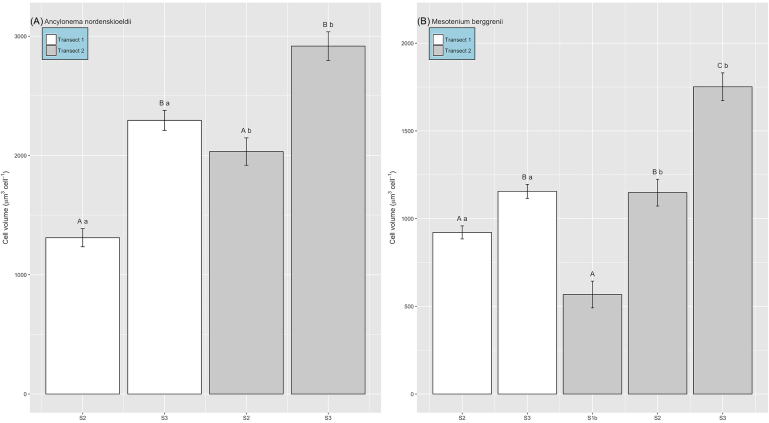
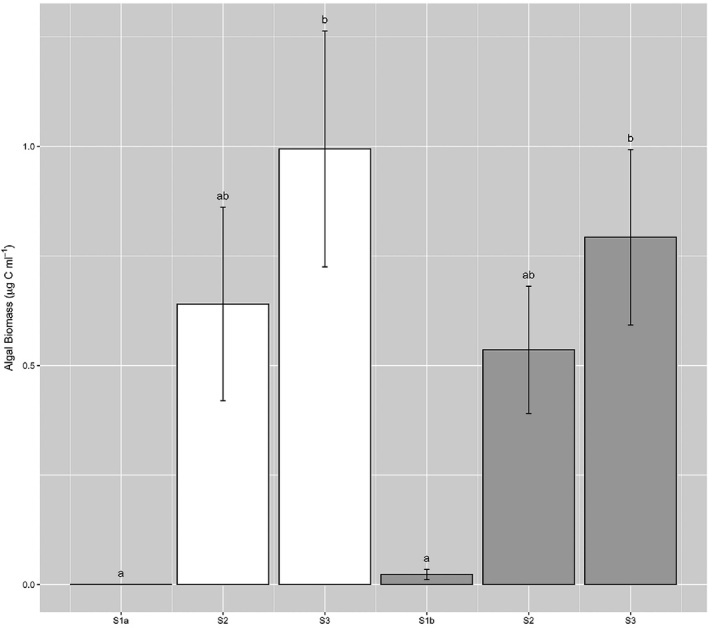
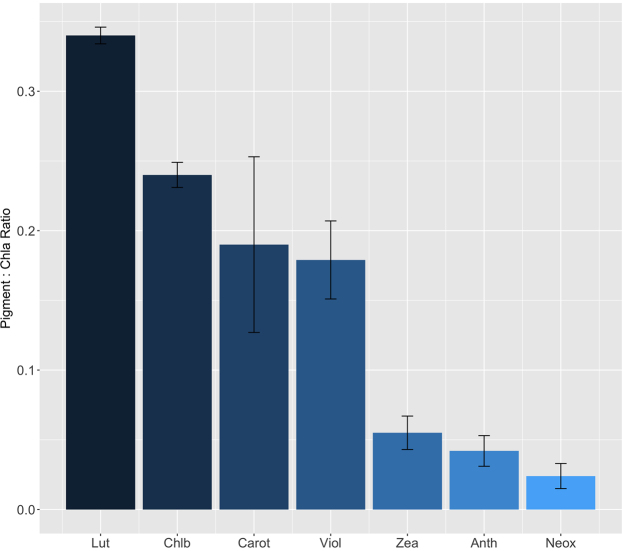
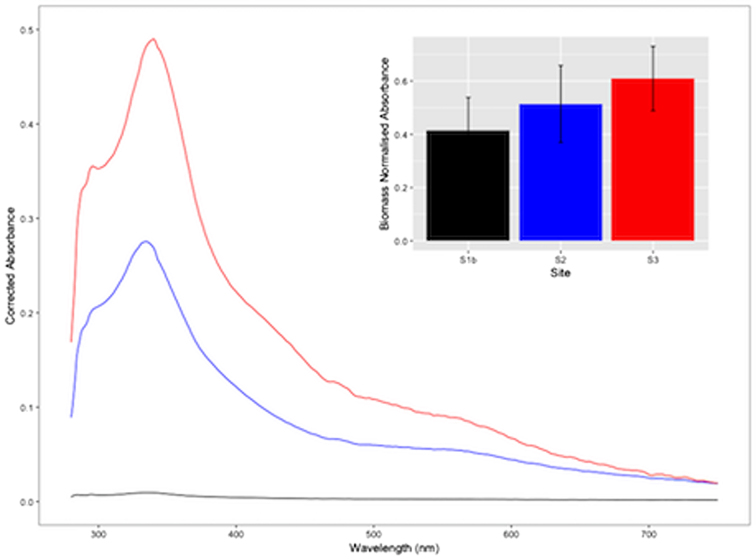
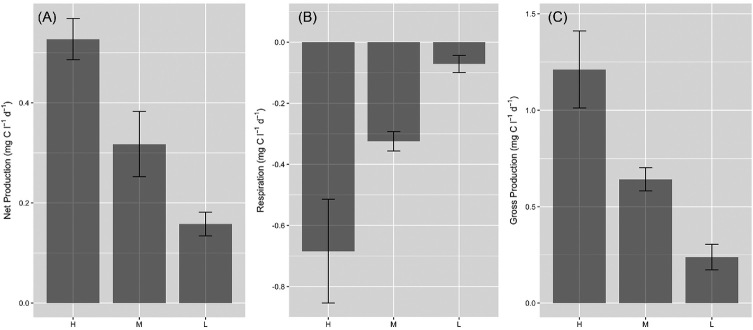
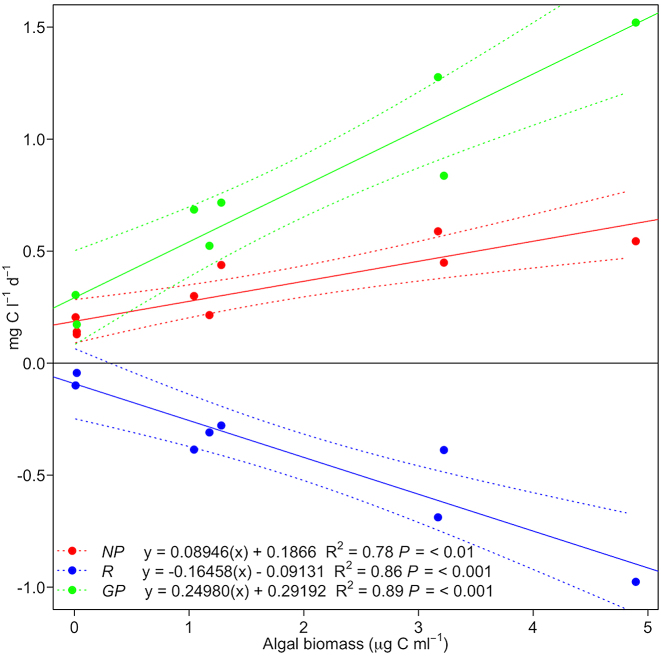
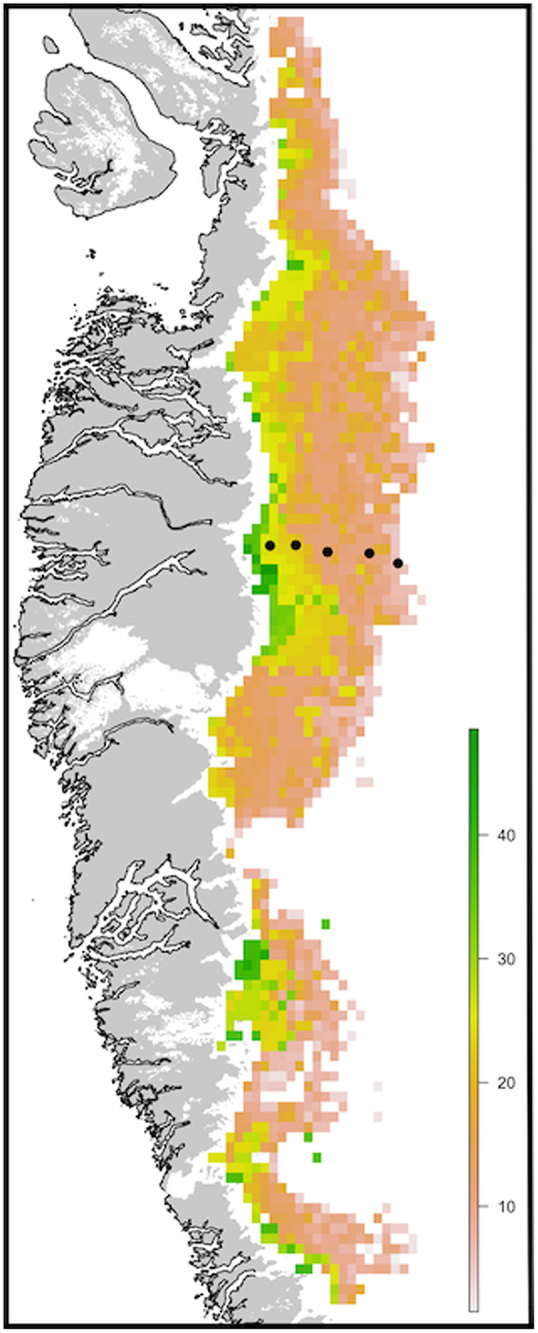
It is fundamental to understand the development of Zygnematophycean (Streptophyte) micro-algal blooms within Greenland Ice Sheet (GrIS) supraglacial environments, given their potential to significantly impact both physical (melt) and chemical (carbon and nutrient cycling) surface characteristics. Here, we report on a space-for-time assessment of a GrIS ice algal bloom, achieved by sampling an ∼85 km transect spanning the south-western GrIS bare ice zone during the 2016 ablation season. Cell abundances ranged from 0 to 1.6 × 10⁴ cells ml-1, with algal biomass demonstrated to increase in surface ice with time since snow line retreat (R2 = 0.73, P < 0.05). A suite of light harvesting and photo-protective pigments were quantified across transects (chlorophylls, carotenoids and phenols) and shown to increase in concert with algal biomass. Ice algal communities drove net autotrophy of surface ice, with maximal rates of net production averaging 0.52 ± 0.04 mg C l-1 d-1, and a total accumulation of 1.306 Gg C (15.82 ± 8.14 kg C km-2) predicted for the 2016 ablation season across an 8.24 × 10⁴ km2 region of the GrIS. By advancing our understanding of ice algal bloom development, this study marks an important step toward projecting bloom occurrence and impacts into the future.


Figures

Figure 1.
Figure 1.
Sampling sites and camp location on the south-western Greenland ice sheet (A), with insert showing the relative position of the sampling region within Greenland. Transect 1 (sites S1a, S2 and S3) was performed on the 27th July 2016 (DOY = 209) and transect 2 (sites S1b, S2, S3) on the 5th August 2016 (DOY = 218). Images show the supraglacial surface environment of sites S1a (B), S2 (C) and S3 (D) during transect 1, illustrating the conspicuous increase in surface impurities apparent across transects toward the ice sheet margin. Ancylonema nordenskiöldii (E) and Mesotaenium berggrenii (F) were shown by this study to dominate surface ice across transects (scale bars = 10 μm in both cases).
Figure 2.
Figure 2.
The relative abundance of Ancylonema nordenskiöldii (Ancylo.), Mesotaenium berggrenii (Meso.), Cylindrocystis brebissonii (Cylindro.) and snow-algal resting spores (Snow) apparent across sampling sites during transect 1 (T1) and transect 2 (T2).
Figure 3.
Figure 3.
Ice algal cell abundance across sampling sites during transect 1 (white bars) and transect 2 (grey bars) (mean ± SE, n = 10). Lower-case letters denote homogenous subsets determined from 1-way ANOVA analysis of algal abundance ∼ site per transect (Transect 1, F2,27 = 5.88, P < 0.01; Transect 2, F2,27 = 6.78, P < 0.01). Separate 1-way ANOVA was performed per transect given the assessment of different sites (S1a/S1b) between transects.
Figure 4.
Figure 4.
Ice algal biovolume of (A) Ancylonema nordenskiöldii and (B) Mesotaenium breggrenii assessed across sampling sites during transect 1 (white bars) and transect 2 (grey bars) (mean ± SE). For A. nordenskiöldii, letters denote homogenous subsets determined from 2-way ANOVA of biovolume ∼ site (upper case letters) + transect (lower-case letters) (F1,23 = 14.98 and 20.81, respectively, P < 0.001 in both cases). For M. berggrenii, given the absence of cells at site S1a during transect 1, biovolume was compared between sites separately across transect 1 (two-sample t-test, t14 = − 3.06, P < 0.01) and transect 2 (1-way ANOVA, F2,18 = 16.7, P < 0.001), and between transects separately for sites S2 (two-sample t-test, t12 = − 2.24 P < 0.05) and S3 (two-sample t-test, t17 = −3.65, P < 0.01). Upper case letters denote homogenous subsets in relation to site, and lower-case letters in relation to transect.
Figure 5.
Figure 5.
Ice algal biomass within surface ice assessed across sampling sites during transect 1 (white bars) and transect 2 (grey bars) (mean ± SE, n = 10). Lower-case letters denote homogenous subsets determined from 1-way ANOVA analysis of algal biomass ∼ site per transect (Transect 1, F2,27 = 7.07, P < 0.01; Transect 2, F2,27 = 8.40, P< 0.01). Separate 1-way ANOVA was performed per transect given the assessment of different sites (S1a/S1b) between transects.
Figure 6.
Figure 6.
Ice algal chlorophyll and carotenoid pigment ratios relative to chlorophyll a (33.02 ± 8.00 fg Chla per pg C−1) assessed from surface ice samples collected at S2 during transect 1 (mean ± SE, n = 5). Lut = lutein, Chlb = chlorophyll b, Carot = β-carotene, Viol = violaxanthin, Zea = zeaxanthin, Anth = antheraxanthin, Neox = neoxanthin.
Figure 7.
Figure 7.
Normalised absorbance spectra of water-soluble pigments derived from surface ice samples at sites S1b (black line), S2 (blue line) and S3 (red line) during transect 2. Insert shows biomass normalised absorbance maxima for the dominant peak (λ335nm) identified across spectra (mean ± SE, n = 5).
Figure 8.
Figure 8.
Spectra obtained during transect 1 illustrating the contrasting spectral reflectance of snow (site S1a), clean ice (0 algal cells ml−1, Site S3) and algal ice (0.76 ± 0.19 × 104 algal cells ml−1, Site S3). HCRF = hemispherical conical reflectance factor, obtained by measuring light reflected from the surface relative to a Spectralon white reference panel. Reference panels can be less reflective than fine grained snow at nadir, explaining reflectance values >100%. Data are presented as a proxy for albedo, though correction for the viewing angle and surface anisotrophy are required to calculate albedo from these data (see Cook et al. 2017).
Figure 9.
Figure 9.
Net production (A), respiration (B) and gross production (C) of surface ice containing a high (H, 3.76 ± 0.56 µg C m−1), medium (M, 1.16 ± 0.06 µg C ml−1) or low (L, 0.01 ± 0.00 µg C ml−1) biomass of ice algae (mean ± SE, n = 3). Lower case letters denote homogenous subsets in relation to biomass for each parameter as determined by 1-way ANOVA (net production, F2,6 = 15.81, P < 0.01; respiration F2,6 = 6.56, P < 0.05; gross production F2,6 = 11.05, P < 0.05). Biomass was significantly different between each biomass category (1-way ANOVA, F2,6 = 33.91, P <0.001).
Figure 10.
Figure 10.
Relationships determined by least-squares linear regression between ice algal biomass and net production (NP, red data), respiration (R, blue data) and gross production (GP, green data), showing regression line (sold lines) and 95% confidence intervals (dashed lines).
Figure 11.
Figure 11.
Total ice algal net production potential (kg C km−2) estimated for the 2016 ablation season within south-western Greenland. Black dots represent sampling sites of the present study where field measurements were performed (see Fig. 1).

References

    1. Anesio AM, Hodson AJ, Andreas F et al. . High microbial activity on glaciers: importance to the global carbon cycle. Glob Chang Biol. 2009;15:955–60.
    1. Anesio AM, Lutz S, Chrismas NAM et al. . The microbiome of glaciers and ice sheets. npj Biofilms Microbiomes. 2017;3:10. - PMC - PubMed
    1. Box JE, Fettweis X, Stroeve JC et al. . The cryosphere Greenland ice sheet albedo feedback: thermodynamics and atmospheric drivers. 2012;6:821–39.
    1. Cameron KA, Stibal M, Hawkings JR et al. . Meltwater export of prokaryotic cells from the Greenland ice sheet. Environ Microbiol. 2017;19:524–34. - PubMed
    1. Chandler DM, Alcock JD, Wadham JL, et al. . Seasonal changes of ice surface characteristics and productivity in the ablation zone of the Greenland Ice Sheet. The Cryosphere. 2015;9:487–504.

Publication types