. 2018 Feb 13;22(7):1657-1665.
doi: 10.1016/j.celrep.2018.01.054.

Chloroplast Signaling Gates Thermotolerance in Arabidopsis

Affiliations

Chloroplast Signaling Gates Thermotolerance in Arabidopsis

Patrick J Dickinson et al. Cell Rep. .

Abstract

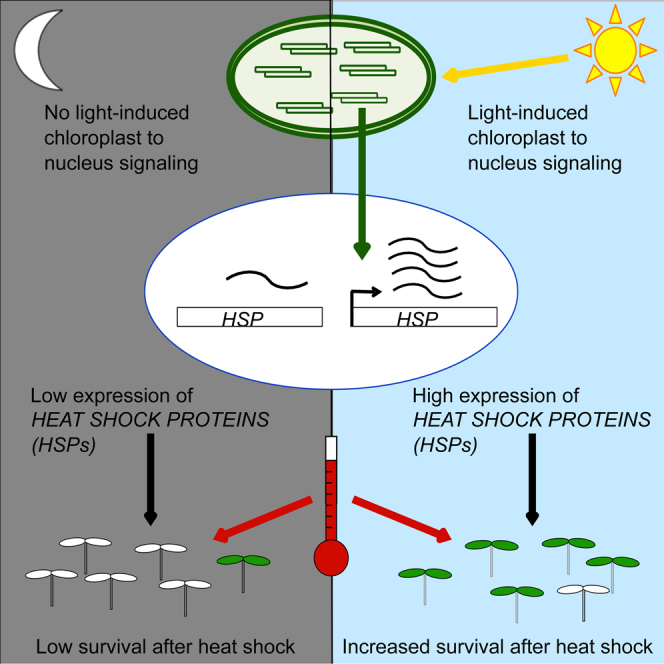
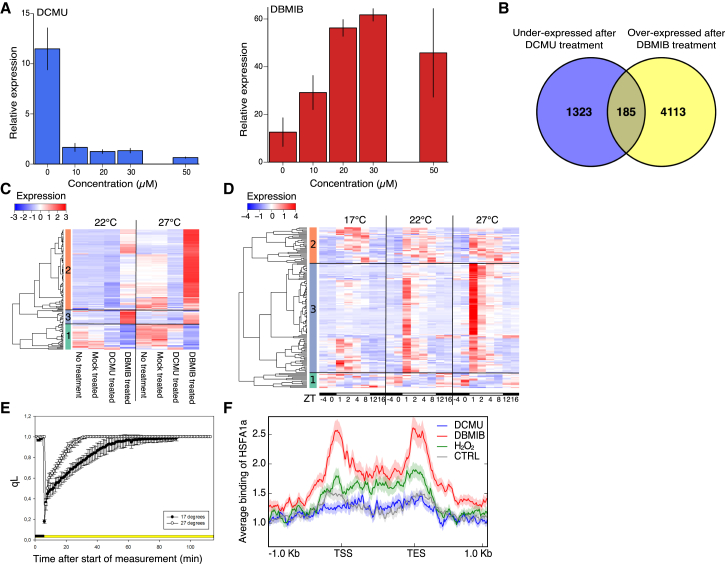
Temperature is a key environmental variable influencing plant growth and survival. Protection against high temperature stress in eukaryotes is coordinated by heat shock factors (HSFs), transcription factors that activate the expression of protective chaperones such as HEAT SHOCK PROTEIN 70 (HSP70); however, the pathway by which temperature is sensed and integrated with other environmental signals into adaptive responses is not well understood. Plants are exposed to considerable diurnal variation in temperature, and we have found that there is diurnal variation in thermotolerance in Arabidopsis thaliana, with maximal thermotolerance coinciding with higher HSP70 expression during the day. In a forward genetic screen, we identified a key role for the chloroplast in controlling this response, suggesting that light-induced chloroplast signaling plays a key role. Consistent with this, we are able to globally activate binding of HSFA1a to its targets by altering redox status in planta independently of a heat shock.

Keywords: Arabidopsis; HSF; HSP70; chloroplast; diurnal; light; plastoquinone; thermotolerance.


Figures

None
Graphical abstract
Figure 1
Figure 1
A Diurnal Pattern of Basal Thermotolerance Correlates with a Diurnal Pattern of Heat-Associated Gene Expression (A) Basal thermotolerance of WT seedlings over a diurnal time course. Error bars are ±SEM (n = 3), where 81 seedlings were scored per time point and temperature for three independent experiments. (B) Heatmap of the expression of genes in cluster 13-1-1. Transcriptomes shown from plants grown in short days (8 hr light, 16 hr dark) at constant 17°C, 22°C, or 27°C. Black bars below heatmap indicate samples taken in the dark (ZT−4, ZT0, ZT12, and ZT16) and white bars indicate samples taken in the light (ZT1, ZT2, ZT4, and ZT8). In heat maps, low to high expression (Z scores) is shown as blue to red. (C–F) Expression of HSP70 in WT seedlings assayed by qRT-PCR. (C) Plants grown at 17°C, 22°C, and 27°C. Error bars are ± the range of two measurements (n = 2) or SEM (n = 3 to 4). (D) Seedlings entrained in short days at 27°C and shifted to constant light or constant dark at ZT8 of the seventh day after germination. Plants were sampled starting at ZT−4 on the eighth day. Error bars are ± the range of two measurements. (E and F) Before and after a 30-min shift to 45°C in seedlings grown at 17°C (E) and 27°C (F). (G) Induction ratios (expression after shift/expression before shift) of HSP70 expression after the temperature shifts in (F) and (G). Error bars are ±SEM (n = 3).
Figure 2
Figure 2
Mutations in Genes Encoding Chloroplast-Localized Proteins Cause Increased HSP70 Expression and Increased Thermotolerance (A) False color image of LUCIFERASE activity of seedlings imaged at 17°C ZT1 and after a shift from 17°C to 27°C from ZT1 to ZT3. Two mutant lines, 2641 and 429, and WT (col-0 containing pHSP70::LUC), are shown from the same plate. (B) Schematics of UP1 and SS4 with the position of mutations shown. Line 429 (up1-2) has a C to T substitution on chromosome (chr) V at locus 2763941 mutating Gln10 to a stop codon. Line 2641 (ss4-4) has a C to T substitution on chr IV at locus 10086122 mutating Gln872 to a stop codon. (C and D) HSP70 expression assayed by qRT-PCR. (C) Mutants at 17°C ZT2 and after a shift from 17°C to 27°C from ZT1 to ZT2. Expression shown relative to WT sampled from the same plate. Error bars are ± the range of two measurements (n = 2) or SEM (n = 3 to 4). (D) up1 and ss4 mutants over a time course at 17°C in short days sampled at ZT−1, ZT0, ZT2, ZT4, ZT8, and ZT12. Error bars are ± the range of two measurements (n = 2) or SEM (n = 3). (E) Thermotolerance of up1-1, ss4-1, and WT with plants grown at 17°C and treated at ZT−1, ZT2, ZT4, ZT8, and ZT12. Error bars are ±SEM (n = 3).
Figure 3
Figure 3
Increased Expression of Heat-Associated Genes in ss4 Is Caused by Alterations to the Light Reactions of Photosynthesis (A) Simplified schematic of the starch synthesis pathway. (B) Heatmap of the expression of genes differentially expressed between ss4-1 and WT at any sampled time-point. Transcriptomes are shown from plants grown in short days at 17°C. Black bars underneath heatmap show samples taken in the dark (ZT−4, ZT0, ZT12, and ZT16) and white bars show samples taken in the light (ZT1, ZT2, ZT4, and ZT8). Replicate shown in Figure S3A. (C) Heatmap of expression of cluster 4 from (B) in ss3/4, pgm, ss3/4/pgm, and WT (col-0) at 17°C ZT0 and ZT2. Replicate shown in Figure S3C. (B and C) Clusters shown on the left of heat maps and low to high expression (Z scores) is shown as blue to red. (D) Basal thermotolerance of ss3/4, pgm, ss3/4/pgm, and WT (col-0) grown at 17°C in short days and treated at ZT−4, ZT−1, ZT0, ZT1, ZT2, ZT4, ZT8, ZT12, and ZT16. Error bars are the range of two measurements.
Figure 4
Figure 4
The Redox State of the Plastoquinone Pool Is Associated with the Expression of the Morning Cluster of Heat-Associated Genes (A) HSP70 expression assayed by qRT-PCR after DCMU and DBMIB treatment of seedlings grown at 22°C in short days. Plants treated at ZT−1 and sampled at ZT1. Error bars are ±SEM (n = 3). (B) Overlaps of genes under-expressed (Log2 fold change <−0.5) after DCMU (30 μM) and overexpressed (Log2 fold change >0.5) after DBMIB (50 μM) treatments compared to a mock treatment at 22°C, treated at ZT−1 and sampled at ZT1. (C) Expression of cluster 13-1-1 (from Figure 1C) in transcriptomes of untreated, mock-treated, DCMU, and DBMIB-treated seedlings at 22°C and 27°C ZT1 after treatment at ZT−1. Replicate shown in Figure S3E. (D) Expression of the genes under-expressed after DCMU treatment and overexpressed after DBMIB treatment (overlap from B) in WT over a 24-hr time course (same as used for Figure 1C) at 17°C, 22°C, and 27°C. Black bars below heatmap indicate samples taken in the dark (ZT−4, ZT0, ZT12, and ZT16) and white bars indicate samples taken in the light (ZT1, ZT2, ZT4, and ZT8). (C and D) Clusters are shown on the left of heatmap and low to high expression (Z scores) is shown as blue to red. (E) qL over dawn at 17°C and 27°C. Error bars are ±SD (n = 4). (F) Average binding of HSFA1a to genes from the intersection of Figure 4B after treatment at ZT−1 with DCMU (30 μM), DBMIB (50 μM), H2O2 (5 mM), and a mock ethanol treatment. Plants sampled at ZT1. Shading represents SE. Replicate shown in Figure S3F.

References

    1. Asseng S., Ewert F., Martre P., Rötter R., Lobell D., Cammarano D., Kimball B.A., Ottman M., Wall G., White J. Rising temperatures reduce global wheat production. Nat. Clim. Chang. 2014;5:143–147.
    1. Box M.S., Coustham V., Dean C., Mylne J.S. Protocol: a simple phenol-based method for 96-well extraction of high quality RNA from Arabidopsis. Plant Methods. 2011;7:7. - PMC - PubMed
    1. Chan K.X., Phua S.Y., Crisp P., McQuinn R., Pogson B.J. Learning the languages of the chloroplast: retrograde signaling and beyond. Annu. Rev. Plant Biol. 2016;67:25–53. - PubMed
    1. Colombo S.J., Timmer V.R., Colclough M.L., Blumwald E. Diurnal variation in heat tolerance and heat shock protein expression in black spruce (Piceamariana) Can. J. For. Res. 1995;25:369–375.
    1. Cortijo S., Charoensawan V., Brestovitsky A., Buning R., Ravarani C., Rhodes D., van Noort J., Jaeger K.E., Wigge P.A. Transcriptional regulation of the ambient temperature response by H2A.Z nucleosomes and HSF1 transcription factors in Arabidopsis. Mol. Plant. 2017;10:1258–1273. - PMC - PubMed

Publication types

MeSH terms