. 2018 Feb 13;22(7):1889-1902.
doi: 10.1016/j.celrep.2018.01.051.

Differential Effector Engagement by Oncogenic KRAS

Affiliations

Differential Effector Engagement by Oncogenic KRAS

Tina L Yuan et al. Cell Rep. .

Abstract

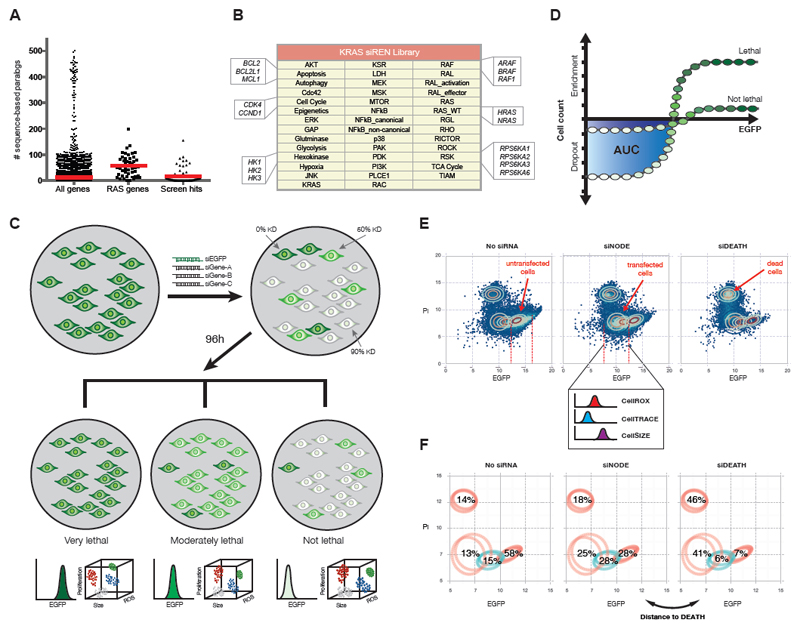
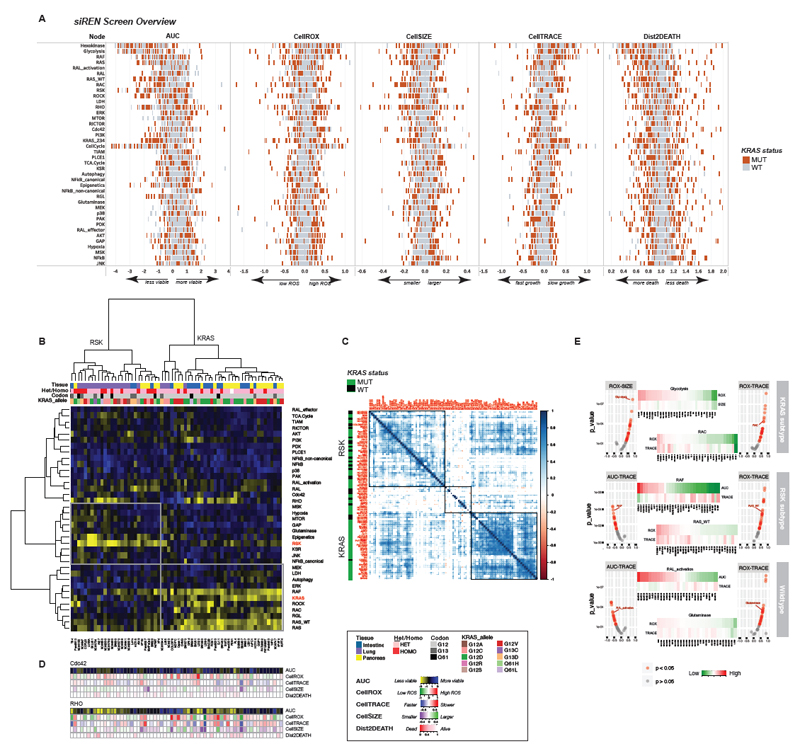
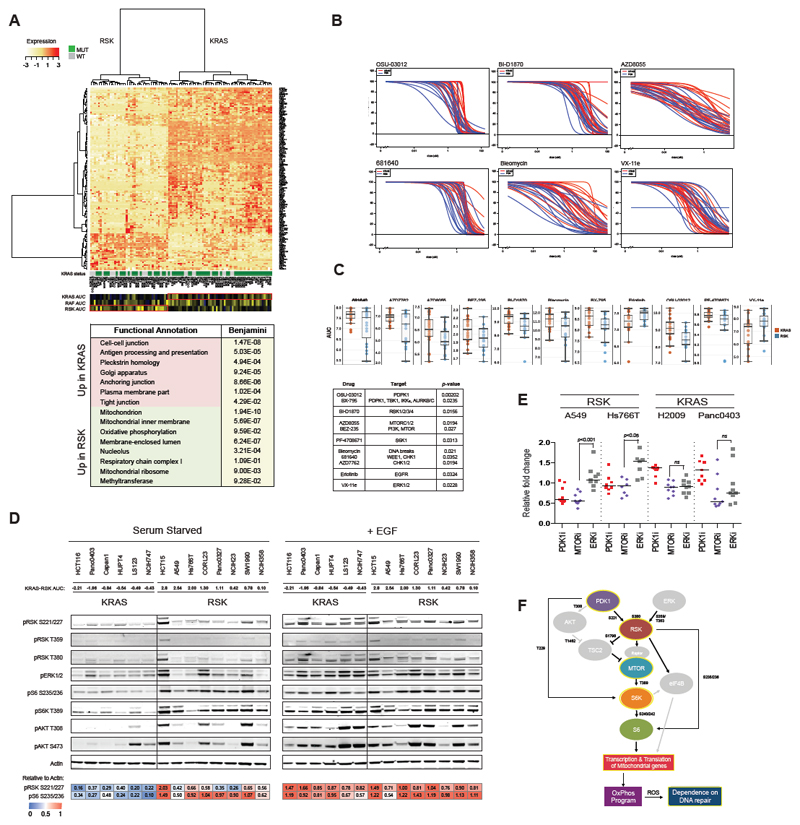
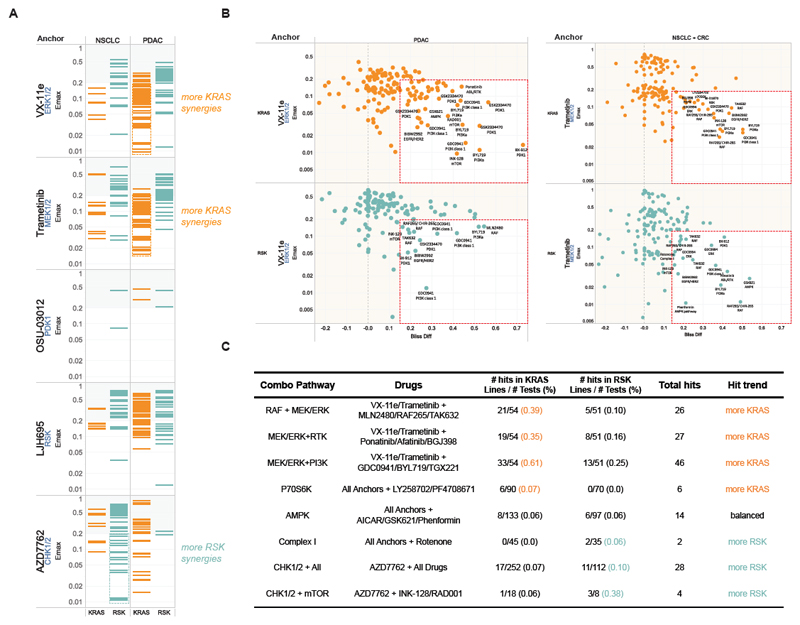
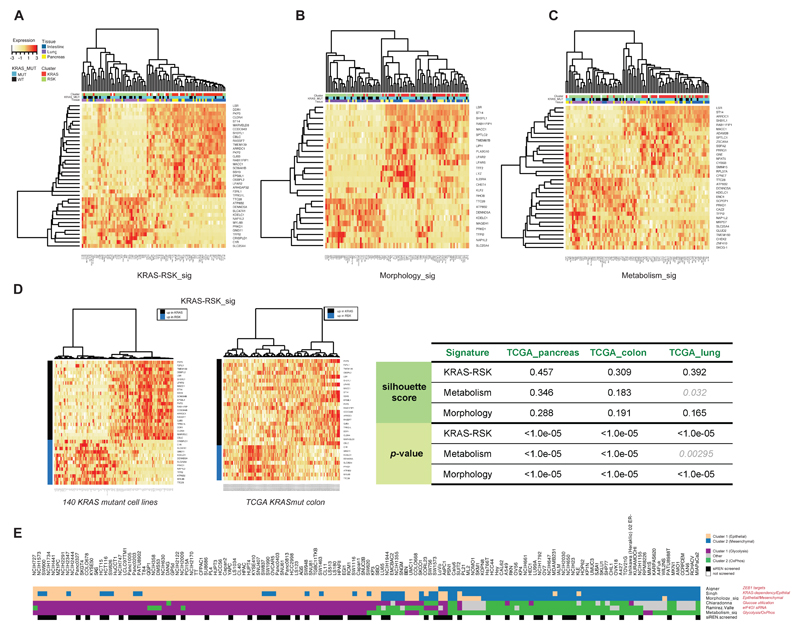
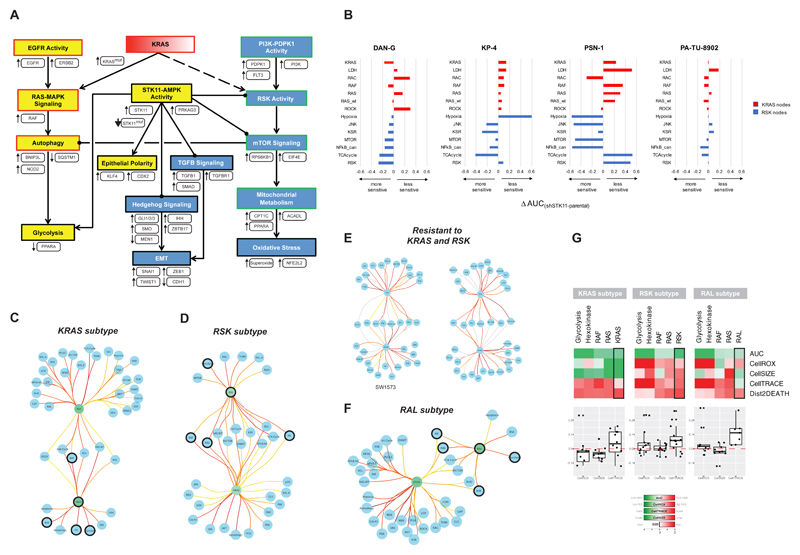
KRAS can bind numerous effector proteins, which activate different downstream signaling events. The best known are RAF, phosphatidylinositide (PI)-3' kinase, and RalGDS families, but many additional direct and indirect effectors have been reported. We have assessed how these effectors contribute to several major phenotypes in a quantitative way, using an arrayed combinatorial siRNA screen in which we knocked down 41 KRAS effectors nodes in 92 cell lines. We show that every cell line has a unique combination of effector dependencies, but in spite of this heterogeneity, we were able to identify two major subtypes of KRAS mutant cancers of the lung, pancreas, and large intestine, which reflect different KRAS effector engagement and opportunities for therapeutic intervention.

Keywords: KRAS; RNAi screen; RSK; paralogs; redundancy.


Conflict of interest statement

Declaration of Interests

The authors declare no competing interests.

Figures

Figure 1
Figure 1
The siREN assay measures node dependencies across cell lines. (A) The number of sequence-based paralogs for all genes, core RAS pathway genes and validated hits from RNAi synthetic lethal screens was compiled from GenesLikeMe (GeneCardsSuite). Means are indicated by red lines. Zinc-finger genes and olfactory receptors were excluded from the analysis, given their extraordinary number of sequence-based paralogs (~500). (B) Forty-one key effector nodes are targeted in the KRAS siREN library, with most nodes represented by multiple single genes. For example, the KRAS node targets only KRAS, the RAS node targets H-, K-, and NRAS and the RAS_WT node targets H- and NRAS. (C) The siREN assay utilizes EGFP as a marker of node knockdown and measures drop-out/enrichment of cells with all levels of knockdown. Multi-color flow cytometry further captures phenotypic readouts such as proliferation rate, cell size and ROS accumulation upon node knockdown. (D) Cell viability is measured by counting the remaining cells with low EGFP 96h after siRNA transfection. Integration of the area under the curve (AUC) in the range of low EGFP cells represents the effect on cell viability. (E) Cells are analyzed by flow cytometry and assigned to one of four distinct Gaussian distributions, which represent untransfected, transfected, and dead cells. Effects on ROS (CellROX), proliferation (CellTRACE) and cell size (CellSIZE) are measured only the population of transfected cells. (F) Cell death (Distance to DEATH) is measured by the similarity in Gaussian profiles between a sample transfected with a positive control (siDEATH) and samples transfected with a siNODE.
Figure 2
Figure 2
KRAS mutant lines consist of two major subtypes. (A) The results of the siREN screen are summarized, showing 5 phenotypic effects of node knockdown (viability, ROS, growth, proliferation and cell death) across 92 cell lines. Each cell line is depicted as a tick mark, with KRAS mutant lines shown in red. All lines were run in technical duplicates (B) Unsupervised hierarchical clustering of KRAS mutant cell lines by AUC reveal two distinct subtypes. Prominent dependencies in each subtype include KRAS and RSK. Tissue lineage (but not zygosity, KRAS codon or KRAS allele) is correlated with subtype membership. (C) Cell line – cell line correlations (Pearson, p < 0.05) based on AUC show that RSK-type lines correlate more strongly with KRAS wildtype lines than mutant lines from the KRAS subtype. (D) The phenotypic effects of Cdc42 or RHO knockdown are featured. Cell lines are ordered as depicted in (B). (E) Correlations between phenotypic readouts in the KRAS subtype, RSK subtype and KRAS wildtype lines are shown for select nodes. Volcano plots show Pearson correlation scores and p-values and heat maps show the raw phenotypic output across lines for the indicated node.
Figure 3
Figure 3
Screen reveals subtype-specific sensitivities to small molecules. (A) Differential gene expression between KRAS- and RSK-type lines reveal 1150 differentially expressed genes (FDR < 0.25). Genes with greater than 2-fold change in expression between subtypes are shown. (B) Forty KRAS mutant lines (21 KRAS-type lines and 19 RSK-type lines) were screened for sensitivity to 11 compounds. All lines were run in biological duplicates. AUCs are shown in (C). (D) Basal and EGF-stimulated signaling in 14 KRAS mutant lines were assessed by western blot. One measure of KRAS-“ness” and RSK-“ness” is the difference in KRAS and RSK AUC, where negative values are more KRAS-like. Blots were quantified with ImageJ. (E) Relative fold change in expression of mitochondrial genes in KRAS- and RSK-type lines was assessed in the presence of PDK1, MTOR and ERK inhibitors. (F) Model of signaling in RSK-type lines features activation of the MTOR pathway to drive oxidative phosphorylation. Processes outlined in yellow were experimentally derived.
Figure 4
Figure 4
Combination drug screen identifies efficient synergies in KRAS- and RSK-type lines. (A) Synergistic events identified with different Anchor Drugs across the drug library within each tissue type and KRAS subtype. Only combinations achieving 15% more activity than predicted by the Bliss hypothesis are shown, and the resulting minimum viability (compared to untreated cells) is plotted (Emax: Maximum combination effect). All lines were run in biological duplicates, with most lines passing quality control (see Supplemental Information). (B) Effective Synergies (x-axis: viability loss over predicted viability, y-axis: viability outcome) for combinations including ERK (left) or MEK (right) inhibitor found in different tissues and for KRAS and RSK subtypes: Hits are in the lower right box of each panel and the most dramatic hits labeled by drug name and target. (C) Pathway and target analysis of effective synergies found in KRAS- and RSK-type lines.
Figure 5
Figure 5
Gene expression signatures stratify cell lines and patient samples into the KRAS and RSK subtypes. Elastic Net-derived genomic features of KRAS and RSK sensitivity were used to compile signatures of KRAS/RSK dependence (KRAS-RSK_sig, A), EMT status (Morphology_sig, B) and glycolysis or oxidative phosphorylation (Metabolism_sig, C). KRAS-RSK_sig was projected onto 140 KRAS mutant lines and TCGA patient samples. The ability to robustly stratify TCGA samples across 3 indications using KRAS-RSK_sig was scored using silhouette (D). (E) Six independently derived signatures of EMT status and metabolic dependency similarly classified 140 KRAS mutant lines, showing a strong correlation between the epithelial-glycolytic state and the mesenchymal-oxidative state.
Figure 6
Figure 6
A network linking morphology and metabolism and a model of oncogene addiction. (A) Summarized mechanistic model linking morphology and metabolism that explains features of KRAS and RSK phenotypes. Evidence is indicated as follows: Yellow nodes – processes that are more active in the KRAS subtype; Blue nodes – processes that are more active in the RSK subtype; White boxes – mechanisms identified by genomic features and/or correlations with KRAS/RSK sensitivity; Red and green borders – KRAS- and RSK-specific processes, respectively, that were empirically observed in the siREN and/or drug assays. (B) The siREN assay was run on four STK11-knockdown lines and their parental controls. All lines were run in technical duplicates. The delta-AUC measures the change in dependency in the knockdown lines compared to parent. (C) KRAS-type lines have fewer edges between KRAS and downstream effector nodes than edges from RSK. (D) RSK-type lines have fewer edges between RSK and downstream effector nodes than edges from KRAS. (E) Two cell lines resistant to both KRAS and RSK have equivalent edges from KRAS and RSK. (F) RAL-type lines have fewer edges between RAL and downstream effectors than edges from KRAS. (G) Knockdown of the 4 common nodes controlled by the onconode in KRAS, RSK and RAL-type lines reveals different phenotypic outcomes. Means of all lines within a subtype are shown (top), and values from individual lines for CellROX, CellTRACE and CellSIZE are plotted (bottom).

Comment in

References

    1. Aigner K, Dampier B, Descovich L, Mikula M, Sultan A, Schreiber M, Mikulits W, Brabletz T, Strand D, Obrist P, et al. The transcription factor ZEB1 (deltaEF1) promotes tumour cell dedifferentiation by repressing master regulators of epithelial polarity. Oncogene. 2007;26:6979–6988. - PMC - PubMed
    1. Barbie DA, Tamayo P, Boehm JS, Kim SY, Moody SE, Dunn IF, Schinzel AC, Sandy P, Meylan E, Scholl C, et al. Systematic RNA interference reveals that oncogenic KRAS-driven cancers require TBK1. Nature. 2009;462:108–112. - PMC - PubMed
    1. Chen RH, Sarnecki C, Blenis J. Nuclear localization and regulation of erk- and rsk-encoded protein kinases. Molecular and cellular biology. 1992;12:915–927. - PMC - PubMed
    1. Chiaradonna F, Sacco E, Manzoni R, Giorgio M, Vanoni M, Alberghina L. Ras-dependent carbon metabolism and transformation in mouse fibroblasts. Oncogene. 2006;25:5391–5404. - PubMed
    1. Cunningham JT, Rodgers JT, Arlow DH, Vazquez F, Mootha VK, Puigserver P. mTOR controls mitochondrial oxidative function through a YY1-PGC-1alpha transcriptional complex. Nature. 2007;450:736–740. - PubMed

Publication types

MeSH terms