. 2018 Feb 13;22(7):1903-1912.
doi: 10.1016/j.celrep.2018.01.062.

Measuring Integrin Conformational Change on the Cell Surface with Super-Resolution Microscopy

Affiliations

Measuring Integrin Conformational Change on the Cell Surface with Super-Resolution Microscopy

Travis I Moore et al. Cell Rep. .

Abstract

We use super-resolution interferometric photoactivation and localization microscopy (iPALM) and a constrained photoactivatable fluorescent protein integrin fusion to measure the displacement of the head of integrin lymphocyte function-associated 1 (LFA-1) resulting from integrin conformational change on the cell surface. We demonstrate that the distance of the LFA-1 head increases substantially between basal and ligand-engaged conformations, which can only be explained at the molecular level by integrin extension. We further demonstrate that one class of integrin antagonist maintains the bent conformation, while another antagonist class induces extension. Our molecular scale measurements on cell-surface LFA-1 are in excellent agreement with distances derived from crystallographic and electron microscopy structures of bent and extended integrins. Our distance measurements are also in excellent agreement with a previous model of LFA-1 bound to ICAM-1 derived from the orientation of LFA-1 on the cell surface measured using fluorescence polarization microscopy.

Keywords: adhesion receptors; cell adhesion; cell migration; cell-surface receptors; iPALM; immunology; integrins; lymphocyte; protein conformation; super-resolution microscopy.


Figures

Figure 1
Figure 1. Integrin Conformational States and iPALM
(A) Three conformational states of integrins (Springer and Dustin, 2012) and the cytoskeletal model of integrin activation. Ellipsoids or ribbon cartoons depict each integrin domain and mEos3.2 with its transition dipole (red double-headed arrows). (B) Left: schematic of sample setup for iPALM imaging of migratory Jurkat T-lymphocytes adhered to ICAM-1 or fibronectin coated lower coverslips, with gold nanorod fiducial markers (orange spheres). Right: zoomed inset of the cell membrane, lower coverslip, and extracellular space. Extracellular regions and membrane bilayer thickness are to scale while talin is longer than shown and distance of actin from the plasma membrane is further than shown. The axial distances that are measured here between the lower coverslip (Z = 0) and the fluorophore (red) of mEOS3.2 (green) are shown with double-headed arrows.
Figure 2
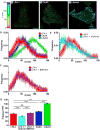
Figure 2. Fluorophore-Coverslip Distances Measured in Cells Migrating on ICAM-1
(A–C) Representative iPALM renderings of Jurkat cells expressing mEOS3.2-LFA-1 fusion (A), mEOS3.2-CAAX (B), or LifeAct-mEos3.2to label actin (C) migrating on substrates coated with 10 μg/mL ICAM-1. Single-molecule iPALM localizations are color-coded by Z position as shown in scale on left. Larger dots correspond to fiducial markers. Scale bars, 5 μm. (D and E) Frequency histograms, with 1 nm bins, of axially localized mEOS3.2 emissions relative to the coverslip (Z = 0) in Jurkat cells migrating on coverslips coated with 10 μg/mL ICAM-1. Data are for the sum of measurements over N cells expressing mEOS3.2-LFA-1 in 1 mM Mg2+ (red, n = 12), 1 mM Mn2+ (purple, n = 9), CAAX-mEOS3.2 (blue, n=13) or LifeAct-mEOS3.2 (green, n = 10). Plots show the frequency(thickline) with 95% bootstrapped confidence interval (shaded region) and Gaussian fit (thin line) of the frequency for each construct. (F) Mean Z median ± SD among n individual cells of mEOS3.2 emission axial localizations for Jurkat cells migrating on coverslips coated with 10 μg/mL ICAM-1. Two-tailed Mann-Whitney tests that compared results among n individual cells enumerated in (D) and (E) gave p values coded as ***p < 0.001 and ****p < 0.0001.
Figure 3
Figure 3. Localization of LFA-1 Headpiece and Effect of Small-Molecule Agonists in Cells Migrating on Fibronectin
(A–C) Representative iPALM renderings of Jurkat cells expressing mEOS3.2-LFA-1 fusion (A), mEOS3.2-CAAX (B), or LifeAct-mEos3.2 to label actin (C) migrating on coverslips coated with 10 μg/mL fibronectin. Single-molecule iPALM localizations are color-coded by Z position as shown in scale on left. Larger dots correspond to fiducial markers. Scale bars, 5 μm. (D–F) Frequency histogram, with 1nm bins, of axially localized mEOS3.2 emissions relative to the coverslip (Z = 0) in Jurkat cells migrating on coverslips coated with 10 μg/mL fibronectin. Data are for the sum of measurements over N cells expressing mEOS3.2-LFA-1 (red, n = 12), treated with 10 μM XVA143 (cyan, n= 11), treated with or 20 μM BIRT377 (purple, n = 8), CAAX-mEOS3.2 (blue, n = 11), LifeAct-mEOS3.2 (green, n = 12). Plots show the frequency (thick line) with 95% bootstrapped confidence interval (shaded region) and Gaussian fit (thin line) of the frequency for each construct. (G) Mean Z median ± SD among n individual cells of mEOS3.2 emission axial localizations for Jurkat cells migrating on coverslips coated with 10 μg/mL fibronectin. Two-tailed Mann-Whitney tests that compared results among n individual cells enumerated in D gave p values coded as ****p < 0.0001 or not significant (NS).
Figure 4
Figure 4. Comparison of Experimental Measurements to Integrin Models
Models of mEos3.2-LFA-1 show extracellular integrin and ICAM-1 domains as ellipsoids or toroids and structurally defined regions of transmembrane and cytoplasmic domains as cylinders (α-helix) or worm-like chains (coils). mEos3.2 inserted in the integrin or with a prenylated C-terminal CAAX sequence is shown as a green ribbon cartoon with a red double-ended cylindrical arrow showing fluorophore position and dipole orientation. Estimates from Table 2 of mEOS3.2-LFA-1 fluorophore height above the membrane on fibronectin and ICAM-1 substrates are shown as thick bars extending ± 1 SEM and lines extending ± 1 SD. The difference in distance between mEOS3.2-LFA-1 Z localizations on fibronectin and ICAM-1 substrates is shown as a dashed line. LFA-1 in the bent-closed conformation and in an ICAM-1-bound extended-open conformation with a tilt of 45° in a previously defined reference frame (Nordenfelt et al., 2017) are shown to scale with the height above the membrane of the mEOS3.2 fluorophore measured from atomic coordinates shown as double-ended black lines with arrowheads at each end.

References

    1. Adair BD, Xiong JP, Alonso JL, Hyman BT, Arnaout MA. EM structure of the ectodomain of integrin CD11b/CD18 and localization of its ligand-binding site relative to the plasma membrane. PLoS ONE. 2013;8:e57951. - PMC - PubMed
    1. Askari JA, Tynan CJ, Webb SE, Martin-Fernandez ML, Ballestrem C, Humphries MJ. Focal adhesions are sites of integrin extension. J Cell Biol. 2010;188:891–903. - PMC - PubMed
    1. Betzig E, Patterson GH, Sougrat R, Lindwasser OW, Olenych S, Bonifacino JS, Davidson MW, Lippincott-Schwartz J, Hess HF. Imaging intracellular fluorescent proteins at nanometer resolution. Science. 2006;313:1642–1645. - PubMed
    1. Bonasio R, Carman CV, Kim E, Sage PT, Love KR, Mempel TR, Springer TA, von Andrian UH. Specific and covalent labeling of a membrane protein with organic fluorochromes and quantum dots. Proc Natl Acad Sci USA. 2007;104:14753–14758. - PMC - PubMed
    1. Calderwood DA, Campbell ID, Critchley DR. Talins and kindlins: partners in integrin-mediated adhesion. Nat Rev Mol Cell Biol. 2013;14:503–517. - PMC - PubMed

Publication types

LinkOut - more resources