

Understanding the rapid increase in life expectancy in shanghai, China: a population-based retrospective analysis
- PMID: 29444657
- PMCID: PMC5813363
- DOI: 10.1186/s12889-018-5112-7
Understanding the rapid increase in life expectancy in shanghai, China: a population-based retrospective analysis
Abstract
Background: Life expectancy at birth (LE) is a comprehensive measure that accounts for age-specific death rates in a population. Shanghai has ranked first in LE in China mainland for decades. Understanding the reasons behind its sustained gain in LE provides a good reflection of many other cities in China. The aim of this study is intended to explore temporal trend in age- and cause-specific gains in LE in Shanghai and the probable reasons lay behind.
Methods: Joinpoint regression was applied to evaluate temporal trend in LE and the long time span was then divided accordingly. Contributions to change in LE (1973-2015) were decomposed by age and cause at corresponding periods.
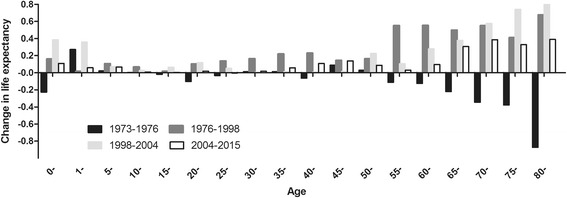
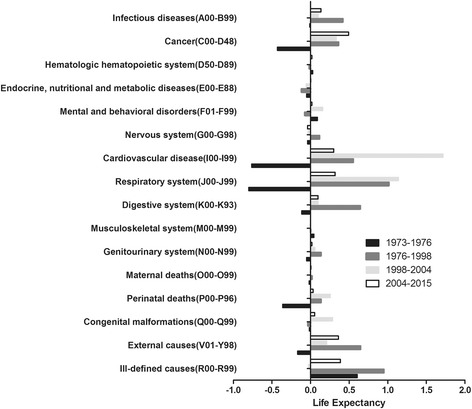
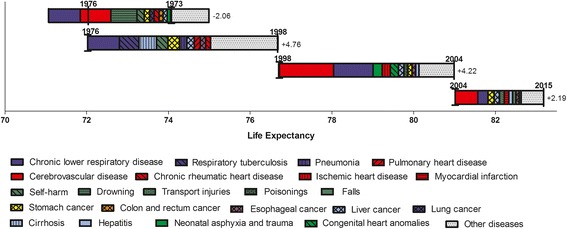
Results: LE in Shanghai could be divided into four phases ie., descent (1973-1976), recovery (1976-1998), rapid rise (1998-2004) and slow rise (2004-2015). The growing LE was mainly attributed to reductions in mortality from the elderly populations and chronic diseases such as cerebrovascular disease, chronic lower respiratory disease, and gastrointestinal cancers (stomach, liver and esophageal cancer).
Conclusions: The four-decade sustained gain in LE in Shanghai is due to the reductions in mortality from the elderly and chronic diseases such as cerebrovascular disease, chronic lower respiratory disease, and gastrointestinal cancers. Further growth momentum still comes from the elderly population.
Keywords: Cause of death; Joinpoint regression analysis; Life expectancy.
Conflict of interest statement
Ethics approval and consent to participate
Our study did not involve any health-related human participants’ interventions. The surveillance protocol was approved by the ethical committee of Shanghai Pudong New Area Center for Disease Control and Prevention. Verbal informed consent was obtained from each subject. Individual information was anonymized and de-identified prior to analysis. Strict confidentiality of individual data was practiced during the entire study.
Consent for publication
Not applicable.
Competing interests
The authors declare that they have no competing interests.
Publisher’s Note
Springer Nature remains neutral with regard to jurisdictional claims in published maps and institutional affiliations.
Figures

References
-
- MHR K, AMA I, Ababneh F. Substantial gender gap reduction in Bangladesh explained by the proximity measure of literacy and life expectancy. J Appl Stat. 2016;
-
- The State Council of the People's Republic of China. Outline of "healthy China 2030". http://www.gov.cn/xinwen/2016-10/25/content_5124174.htm. Accessed October 25,2016.
-
- National Health and Family Planning Commission of the People's Republic of China. To increase life expectancy reflects the determination of Chinese government. http://www.nhfpc.gov.cn/xcs/mtbd1/201603/727a8881d09a4c81b3175a2f7a272f7.... Accessed 6 Mar 2016.
-
- Shen J. Changing trends of life expectancy and effect on associated factors in China urban cities [in Chinese] Shanghai: Fudan University; 2013.
Publication types
MeSH terms
Grants and funding
LinkOut - more resources
Full Text Sources
Other Literature Sources
