. 2018 Feb 14;23(1):8.
doi: 10.1186/s40001-018-0307-z.

Whole bone testing in small animals: systematic characterization of the mechanical properties of different rodent bones available for rat fracture models

Affiliations

Whole bone testing in small animals: systematic characterization of the mechanical properties of different rodent bones available for rat fracture models

Peter M Prodinger et al. Eur J Med Res. .

Abstract

Objectives: Rat fracture models are extensively used to characterize normal and pathological bone healing. Despite, systematic research on inter- and intra-individual differences of common rat bones examined is surprisingly not available. Thus, we studied the biomechanical behaviour and radiological characteristics of the humerus, the tibia and the femur of the male Wistar rat-all of which are potentially available in the experimental situation-to identify useful or detrimental biomechanical properties of each bone and to facilitate sample size calculations.

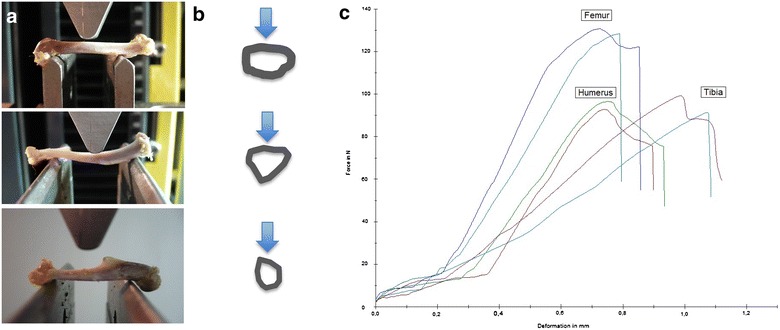
Methods: 40 paired femura, tibiae and humeri of male Wistar rats (10-38 weeks, weight between 240 and 720 g) were analysed by DXA, pQCT scan and three-point-bending. Bearing and loading bars of the biomechanical setup were adapted percentually to the bone's length. Subgroups of light (skeletal immature) rats under 400 g (N = 11, 22 specimens of each bone) and heavy (mature) rats over 400 g (N = 9, 18 specimens of each bone) were formed and evaluated separately.

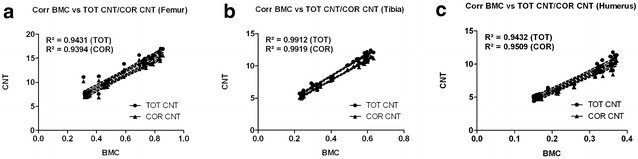
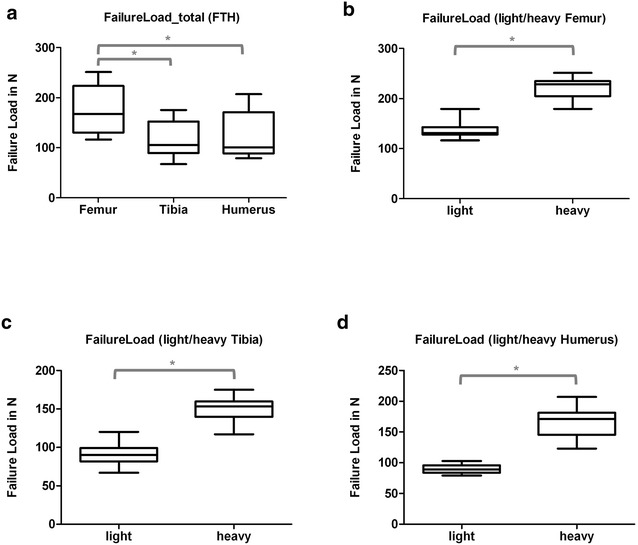
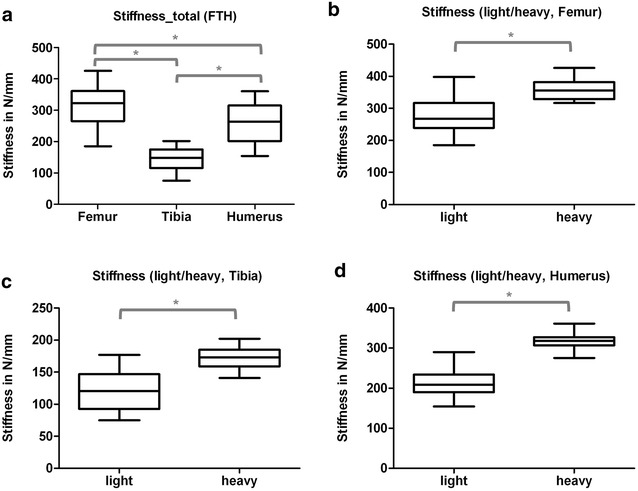
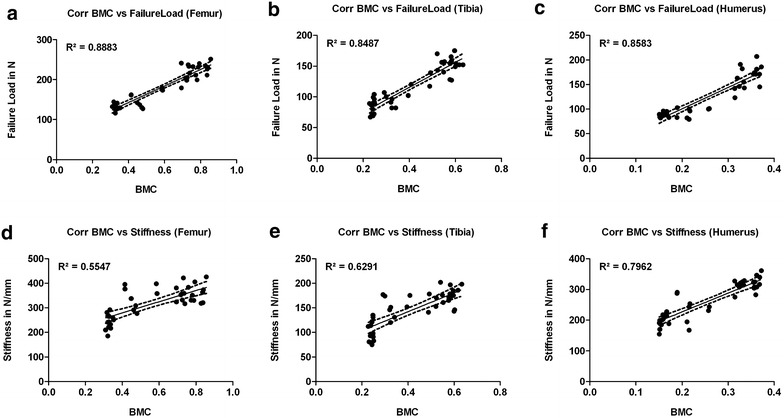
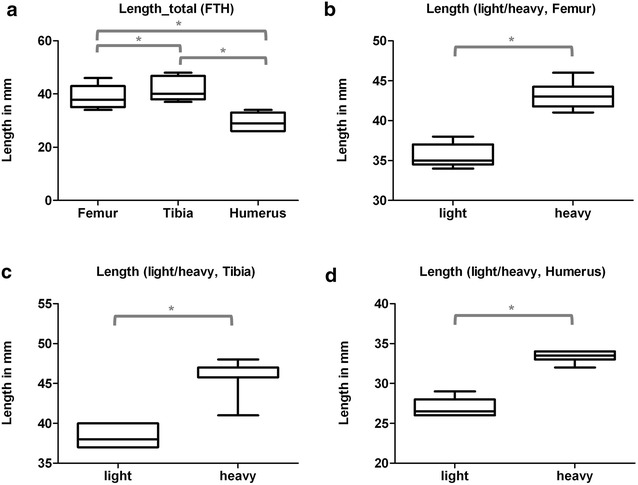
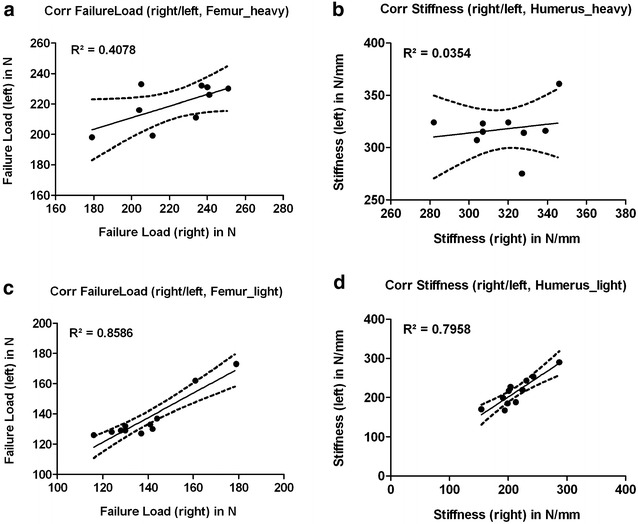
Results: Radiologically, neither significant differences between left and right bones, nor a specific side preference was evident. Mean side differences of the BMC were relatively small (1-3% measured by DXA and 2.5-5% by pQCT). Over all, bone mineral content (BMC) assessed by DXA and pQCT (TOT CNT, CORT CNT) showed high correlations between each other (BMC vs. TOT and CORT CNT: R2 = 0.94-0.99). The load-displacement diagram showed a typical, reproducible curve for each type of bone. Tibiae were the longest bones (mean 41.8 ± 4.12 mm) followed by femurs (mean 38.9 ± 4.12 mm) and humeri (mean 29.88 ± 3.33 mm). Failure loads and stiffness ranged from 175.4 ± 45.23 N / 315.6 ± 63.00 N/mm for the femurs, 124.6 ± 41.13 N / 260.5 ± 59.97 N/mm for the humeri to 117.1 ± 33.94 N / 143.8 ± 36.99 N/mm for the tibiae. Smallest interindividual differences were observed in failure loads of the femurs (CV% 8.6) and tibiae (CV% 10.7) of heavy animals, light animals showed good consistency in failure loads of the humeri (CV% 7.7). Most consistent results of both sides (left vs. right) in failure loads were provided by the femurs of light animals (mean difference 4.0 ± 2.8%); concerning stiffness, humeri of heavy animals were most consistent (mean difference of 6.2 ± 5%). In general, the failure loads showed strong correlations to the BMC (R2 = 0.85-0.88) whereas stiffness correlated only moderate, except for the humerus (BMC vs. stiffness: R2 = 0.79).

Discussion: Altogether, the rat's femur of mature specimens showed the most accurate and consistent radiological and biomechanical results. In synopsis with the common experimental use enabling comparison among different studies, this bone offers ideal biomechanical conditions for three point bending experiments. This can be explained by the combination of a superior aspect ratio and a round and long, straight morphology, which satisfies the beam criteria more than other bones tested.


Figures

Fig. 1
Fig. 1
Biomechanical setup, diaphyseal bone cross sections and load–displacement diagram. First column a: Setup of 3-point bending for femurs, tibiae and humeri. Individual adjustment of breaking and loading bars for each bone specimen correspond to pQCT-measurement areas. Femurs and humeri are loaded in ap-direction, tibiae in pa-direction. Second column b: Schemes of cross-sectional pQCT-images at the level of the loading intender (femur, tibia and humerus). Arrows mark the direction of the applied force. Load–displacement diagram of the six tested bones of one individuum (c). X axis shows the deformation in mm, y axis the reaction forces in N. The fracture-curves of both sides were very similar and characteristically for the bone-subtype tested
Fig. 2
Fig. 2
Correlation graphs (Bivariate Scattergrams with regression lines and 95% confidence bands). a Correlation graphs of BMC (DEXA, g/cm3) vs. TOT CNT and CRT CNT (pQCT) for femurs. b Correlation graphs of BMC (DEXA, g/cm3) vs. TOT CNT and CRT CNT (pQCT) for tibiae. c Correlation graphs of BMC (DEXA, g/cm3) vs. TOT CNT and CRT CNT (pQCT) for humeri. In summary high correlations between both radiological methods could be achieved. BMC bone mineral content, TOT CNT total content, CRT CNT cortical content
Fig. 3
Fig. 3
Box plots, failure loads (N) for al tested bones (a) and for each bone-type separated into specimens of light (< 400 g) and heavy (< 400 g) animals (bd). * Indicates significant difference. a Summary (Group comparisons by One-way ANOVA, Tukey’s test). b Femur (Group comparisons by t test). c Tibia (Group comparisons by t test). d Humerus (Group comparisons by t test)
Fig. 4
Fig. 4
Box plots, stiffness (N/mm) for al tested bones (a) and for each bone-type separated into specimens of light (< 400 g) and heavy (< 400 g) animals (bd). * Indicates significant difference. a Summary (Group comparisons by One-way ANOVA, Tukey’s test). b Femur (Group comparisons by t test). c Tibia (Group comparisons by t test). d Humerus (Group comparisons by t test)
Fig. 5
Fig. 5
Correlation graphs (Bivariate Scattergrams with regression lines and 95% confidence bands). First line: correlation of the BMC with failure loads for femurs (a), tibiae (b) and humeri (c). In general, strong correlations of the BMC with failure loads could be observed. Second line: correlation of the BMC with stiffness for femurs (d), tibiae (e) and humeri (f). Here, only moderate correlations could be shown, except for the humerus (f)
Fig. 6
Fig. 6
Box plots, length (mm) for al tested bones (a) and for each bone-type separated into specimens of light (< 400 g) and heavy (< 400 g) animals (bd). * Indicates significant difference. a Summary (Group comparisons by One-way ANOVA, Tukey’s test). b Femur (Group comparisons by t test). c Tibia (Group comparisons by t test). d Humerus (Group comparisons by t test)
Fig. 7
Fig. 7
Correlation graphs (Bivariate Scattergrams with regression lines and 95% confidence bands). Left column (a, c): correlation of the failure loads of the left and the corresponding right side for femurs of heavy animals (a) and light animals (c). Whereas the correlation in heavy animals was weak and almost random-like, light animals showed a strong correlation. Right column (b, d): correlation of the stiffness of the left and the corresponding right side for humeri of heavy animals (b) and light animals (d). No correlation in heavy animals, the humerus of light animals was the only bone reaching an acceptable correlation of the right and the left sides

Similar articles

Cited by

References

    1. Bissinger O, et al. A biomechanical, micro-computertomographic and histological analysis of the influence of diclofenac and prednisolone on fracture healing in vivo. BMC Musculoskelet Disord. 2016;17(1):383. doi: 10.1186/s12891-016-1241-2. - DOI - PMC - PubMed
    1. Prodinger PM, et al. Does anticoagulant medication alter fracture-healing? A morphological and biomechanical evaluation of the possible effects of rivaroxaban and enoxaparin using a rat closed fracture model. PLoS ONE. 2016;11(7):e0159669. doi: 10.1371/journal.pone.0159669. - DOI - PMC - PubMed
    1. Sugiyama T, et al. Warfarin-induced impairment of cortical bone material quality and compensatory adaptation of cortical bone structure to mechanical stimuli. J Endocrinol. 2007;194(1):213–222. doi: 10.1677/JOE-07-0119. - DOI - PubMed
    1. Vashishth D. Small animal bone biomechanics. Bone. 2008;43(5):794–797. doi: 10.1016/j.bone.2008.06.013. - DOI - PMC - PubMed
    1. Leppanen OV, Sievanen H, Jarvinen TL. Biomechanical testing in experimental bone interventions—may the power be with you. J Biomech. 2008;41(8):1623–1631. doi: 10.1016/j.jbiomech.2008.03.017. - DOI - PubMed