. 2018 Mar;25(3):367-380.
doi: 10.1530/ERC-17-0445.

The neuroendocrine phenotype, genomic profile and therapeutic sensitivity of GEPNET cell lines

Affiliations

The neuroendocrine phenotype, genomic profile and therapeutic sensitivity of GEPNET cell lines

Tobias Hofving et al. Endocr Relat Cancer. 2018 Mar.

Erratum in

Abstract

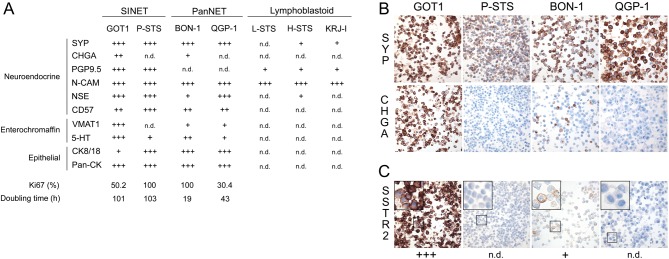
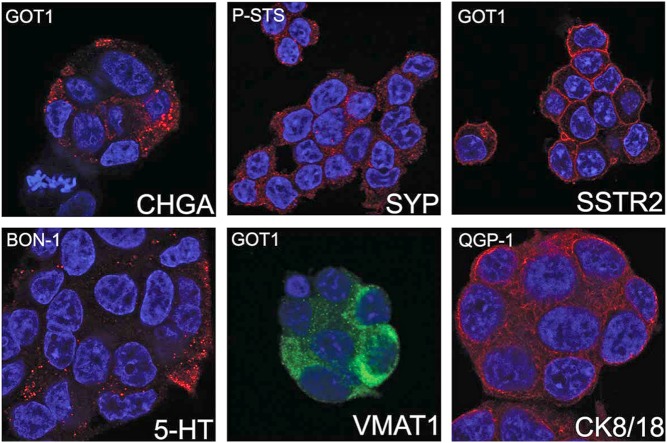
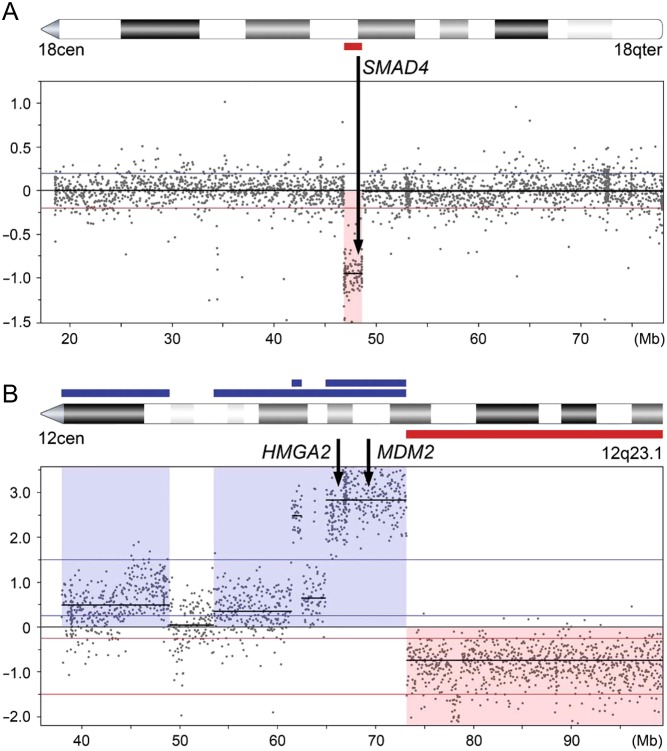
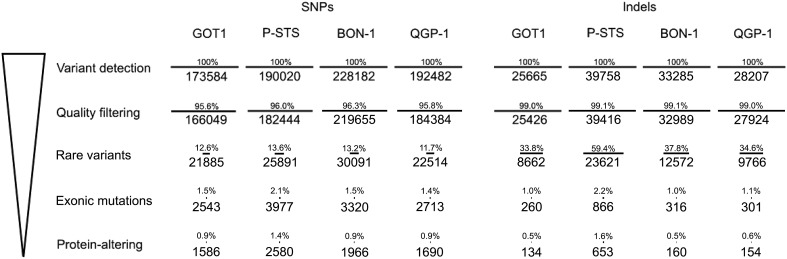
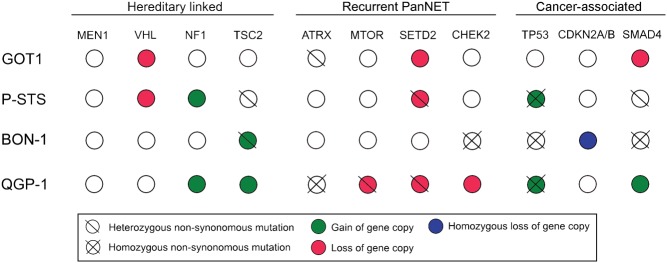
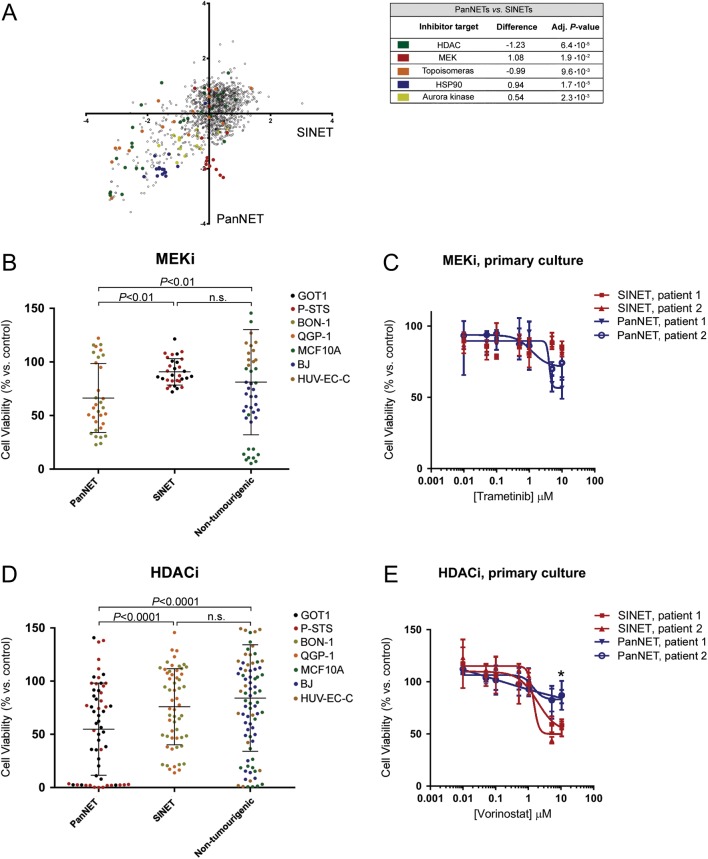
Experimental models of neuroendocrine tumour disease are scarce, and no comprehensive characterisation of existing gastroenteropancreatic neuroendocrine tumour (GEPNET) cell lines has been reported. In this study, we aimed to define the molecular characteristics and therapeutic sensitivity of these cell lines. We therefore performed immunophenotyping, copy number profiling, whole-exome sequencing and a large-scale inhibitor screening of seven GEPNET cell lines. Four cell lines, GOT1, P-STS, BON-1 and QGP-1, displayed a neuroendocrine phenotype while three others, KRJ-I, L-STS and H-STS, did not. Instead, these three cell lines were identified as lymphoblastoid. Characterisation of remaining authentic GEPNET cell lines by copy number profiling showed that GOT1, among other chromosomal alterations, harboured losses on chromosome 18 encompassing the SMAD4 gene, while P-STS had a loss on 11q. BON-1 had a homozygous loss of CDKN2A and CDKN2B, and QGP-1 harboured amplifications of MDM2 and HMGA2 Whole-exome sequencing revealed both disease-characteristic mutations (e.g. ATRX mutation in QGP-1) and, for patient tumours, rare genetic events (e.g. TP53 mutation in P-STS, BON-1 and QGP-1). A large-scale inhibitor screening showed that cell lines from pancreatic NETs to a greater extent, when compared to small intestinal NETs, were sensitive to inhibitors of MEK. Similarly, neuroendocrine NET cells originating from the small intestine were considerably more sensitive to a group of HDAC inhibitors. Taken together, our results provide a comprehensive characterisation of GEPNET cell lines, demonstrate their relevance as neuroendocrine tumour models and explore their therapeutic sensitivity to a broad range of inhibitors.

Keywords: GEPNET; cell lines; copy number alterations; exome sequencing; immunophenotyping; inhibitor screening; neuroendocrine tumour; trametinib; vorinostat.


Figures

Figure 1
Figure 1
Expression of neuroendocrine markers and somatostatin receptor 2 in GEPNET cell lines. (A) Scoring of protein expression based on immunohistochemical staining of cell blocks. 5-HT was evaluated from confocal laser scanning microscopy. (B and C) Immunohistochemical staining of cell blocks, illustrating expression of the neuroendocrine markers synaptophysin and chromogranin A (B), and clinically relevant SSTR2 (C) in GEPNET cell lines. CHGA, chromogranin A; SYP, synaptophysin; PGP9.5, ubiquitin carboxyl-terminal hydrolase isozyme L1; N-CAM, neural cell adhesion molecule 1; NSE, gamma-enolase; 5-HT, serotonin; VMAT1, chromaffin granule amine transporter 1; cytokeratin 8/18, keratin type II cytoskeletal 8/type I cytoskeletal 18; pan-CK, pan-cytokeratin; SSTR2, somatostatin receptor type 2; n.d., not detected.
Figure 2
Figure 2
The subcellular localisation of neuroendocrine markers in GEPNET cell lines. The staining pattern of chromogranin A (CHGA), synaptophysin (SYP), chromaffin granule amine transporter 1 (VMAT1) and serotonin (5-HT) was consistent with localisation to secretory granules. The staining of somatostatin receptor type 2 (SSTR2) and cytokeratin 8/18 (CK8/18) was confirmed to be membranous and cytoskeletal, respectively.
Figure 3
Figure 3
Copy number alterations detected in four GEPNET cell lines. (A) GOT1 harboured a loss of a 1.8 Mb segment on chromosome 18q, encompassing the SMAD4 gene. (B) Of the three amplicons on chromosome 12 that QGP-1 harboured, one spanned 12q12.2–q21.1 including the HMGA2 and MDM2 genes.
Figure 4
Figure 4
Whole-exome sequencing of GEPNET cell lines. Successive filtering with the remaining number of SNPs or indels in each step is shown. Percentage is relative to the number of variants detected in the detection step.
Figure 5
Figure 5
Genomic events involving genes linked to hereditary endocrine tumour syndromes, genes recurrently mutated in GEPNETs, and cancer-associated genes. Four genes have been hereditary linked to GEPNETs, none of which had bi-allelic inactivation in the cell lines. Out of previously identified recurrently mutated genes in GEPNETS, four had bi-allelic inactivations: ATRX (QGP-1), MTOR (QGP-1), SETD2 (P-STS and QGP-1), and CHEK2 (BON-1). Out of the 127 genes identified by the Tumor Cancer Genome Atlas, 49 had one or more protein-altering mutations in the cell lines; these genes included key tumour suppressors TP53, CDKN2A, CDKN2B and SMAD4.
Figure 6
Figure 6
Therapeutic sensitivity of GEPNET cell lines and primary cell cultures. (A) Average Z-score representing effect on cell viability of individual inhibitors to SINETs (GOT1/P-STS) and PanNETs (BON-1/QGP-1), plotted against each other. Groups of inhibitors that are significantly more potent against SINETs or PanNETs are marked by colour. (B) The effect of all MEKi against SINET cells, PanNET cells and non-tumourigenic cells. MEKi are more potent against PanNET cells, compared to SINET and non-tumourigenic cells. (C) Comparing the sensitivity of PanNET and SINET first-passage primary cells to MEKi trametinib. (D) SINET cell lines are more sensitive to HDACi, compared to PanNET cells and non-tumourigenic cells. (E) First-passage primary SINET cells are seemingly more sensitive than primary PanNET cells to the HDACi vorinostat. (B and D) Bars indicate mean effect, error bars s.d. and P values generated from Wilcoxon signed-rank test. (C and E) Dose–response curves represent a mean of n = 3 and the error bars denote standard deviation (s.d.).

References

    1. Abe N, Watanabe T, Suzuki Y, Matsumoto N, Masaki T, Mori T, Sugiyama M, Chiappetta G, Fusco A, Atomi Y. 2003. An increased high-mobility group A2 expression level is associated with malignant phenotype in pancreatic exocrine tissue. British Journal of Cancer 89 2104–2109. (10.1038/sj.bjc.6601391) - DOI - PMC - PubMed
    1. Alberici P, Jagmohan-Changur S, De Pater E, Van Der Valk M, Smits R, Hohenstein P, Fodde R. 2006. Smad4 haploinsufficiency in mouse models for intestinal cancer. Oncogene 25 1841–1851. (10.1038/sj.onc.1209226) - DOI - PubMed
    1. Andersson E, Swärd C, Stenman G, Ahlman H, Nilsson O. 2009. High-resolution genomic profiling reveals gain of chromosome 14 as a predictor of poor outcome in ileal carcinoids. Endocrine-Related Cancer 16 953–966. (10.1677/ERC-09-0052) - DOI - PubMed
    1. Andersson E, Arvidsson Y, Swärd C, Hofving T, Wängberg B, Kristiansson E, Nilsson O. 2016. Expression profiling of small intestinal neuroendocrine tumors identifies subgroups with clinical relevance, prognostic markers and therapeutic targets. Modern Pathology 29 616–629. (10.1038/modpathol.2016.48) - DOI - PubMed
    1. Arvidsson Y, Bergström A, Arvidsson L, Kristiansson E, Ahlman H, Nilsson O. 2010. Hypoxia stimulates CXCR4 signalling in ileal carcinoids. Endocrine-Related Cancer 17 303–316. (10.1677/ERC-09-0085) - DOI - PubMed

Publication types

MeSH terms

Supplementary concepts