. 2018 Feb 14;51(2):1701245.
doi: 10.1183/13993003.01245-2017. Print 2018 Feb.

Analysis of airway pathology in COPD using a combination of computed tomography, micro-computed tomography and histology

Affiliations

Analysis of airway pathology in COPD using a combination of computed tomography, micro-computed tomography and histology

Naoya Tanabe et al. Eur Respir J. .

Abstract

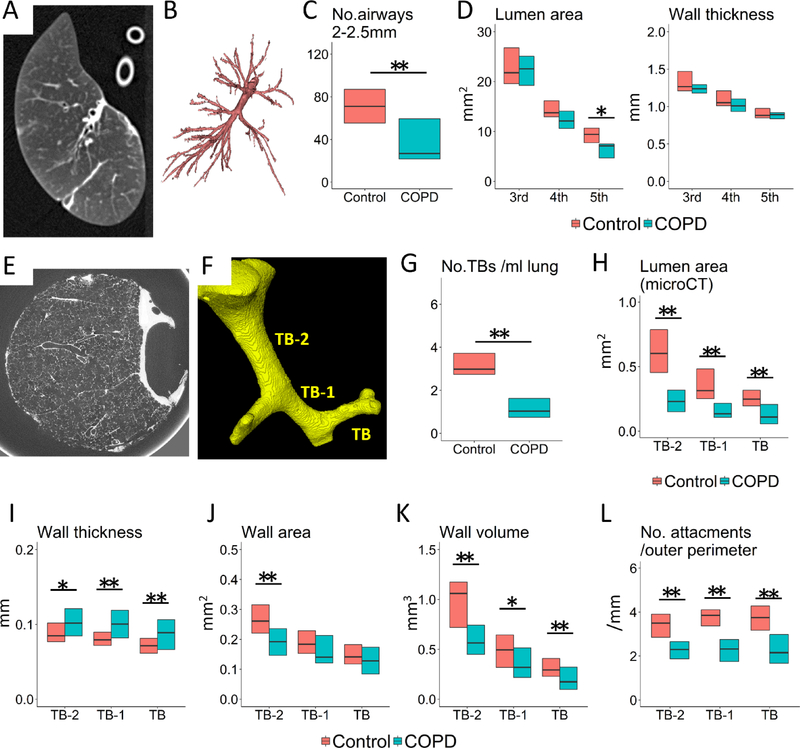
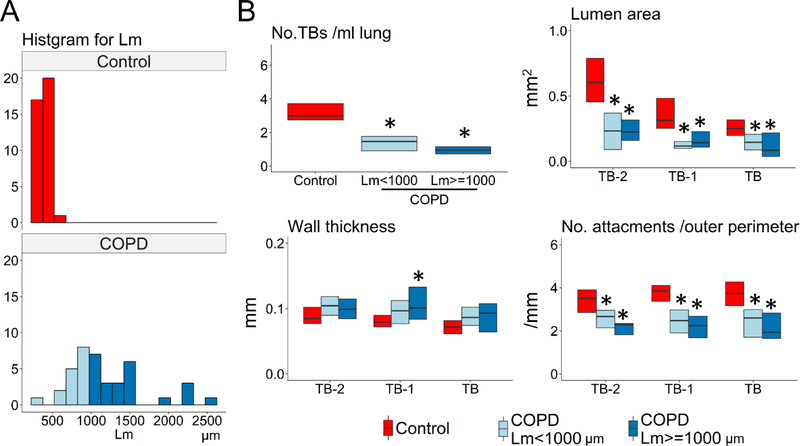
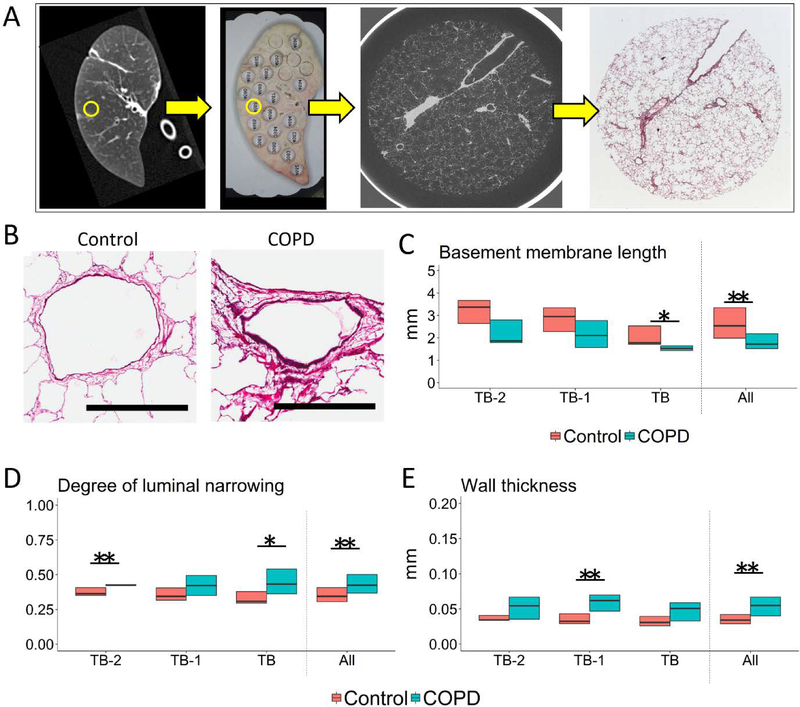
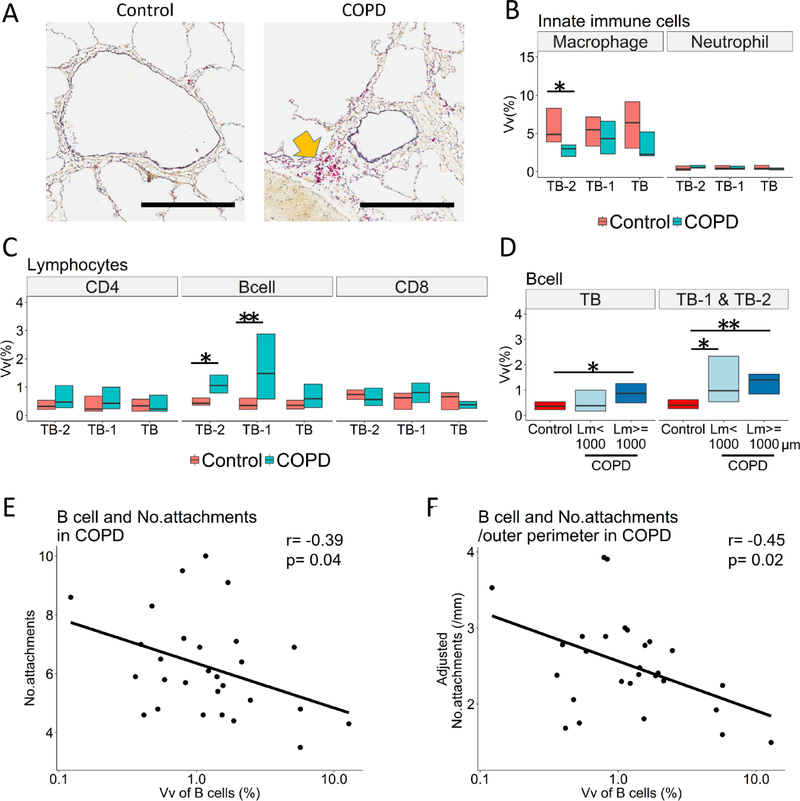
The small conducting airways are the major site of obstruction in chronic obstructive pulmonary disease (COPD). This study examined small airway pathology using a novel combination of multidetector row computed tomography (MDCT), micro-computed tomography (microCT) and histology.Airway branches visible on specimen MDCT were counted and the dimensions of the third- to fifth-generation airways were computed, while the terminal bronchioles (designated TB), preterminal bronchioles (TB-1) and pre-preterminal bronchioles (TB-2) were examined with microCT and histology in eight explanted lungs with end-stage COPD and seven unused donor lungs that served as controls.On MDCT, COPD lungs showed a decrease in the number of 2-2.5 mm diameter airways and the lumen area of fifth-generation airways, while on microCT there was a reduction in the number of terminal bronchioles as well as a decrease in the luminal areas, wall volumes and alveolar attachments to the walls of TB, TB-1 and TB-2 bronchioles. The combination of microCT and histology showed increased B-cell infiltration into the walls of TB-1 and TB-2 bronchioles, and this change was correlated with a reduced number of alveolar attachments in COPD.Small airways disease extends from 2 mm diameter airways to the terminal bronchioles in COPD. Destruction of alveolar attachments may be driven by a B-cell-mediated immune response in the preterminal bronchioles.


Conflict of interest statement

Conflict of interest: Disclosures can be found alongside this article at erj.ersjournals.com

Figures

Figure 1.
Figure 1.. Specimen MDCT and microCT analysis of airways
(A) shows a MDCT scan, from which the airway tree is segmented (B). MDCT measurements show the number of airway branches 2 to 2.5 mm in diameter (C) and luminal area of the 5th generation airways (sub-subsegmental) are decreased in COPD compared to control lungs while wall thickness does not differ (D). (E) shows a microCT scan, from which the lumen of terminal (TB), preterminal (TB-1), and pre-preterminal (TB-2) bronchioles were segmented (F). MicroCT measurements show the number of TBs (G) and the luminal areas of TB, TB-1, and TB-2 (H) are decreased in COPD compared to control lungs. These measurements also show increases in the wall thickness of TB, TB-1, and TB-2 (I) and the wall area of TB-2 (J) and decreases in the wall volume (K) and the number of alveolar attachments per outer perimeter (L) of TB, TB-1, and TB-2 in COPD. * p<0.05 and ** p<0.01.
Figure 2.
Figure 2.. MDCT and microCT comparisons between control and COPD samples with different severity of emphysema
(A) A histogram for mean linear intercept (Lm) in control and COPD. In order to compare mild emphysematous regions of the COPD lungs with controls, COPD samples were divided into those with Lm <1000 μm (n=16) and Lm ≥1000 μm (n=24). (B) The number of terminal bronchioles (TBs) per ml lung, the mean lumen area, and the number of alveolar attachments per length of outer perimeter of TB, TB-1, and TB-2 were decreased in both groups of COPD samples compared to controls. * p<0.05 vs control.
Figure 3.
Figure 3.. Structural evaluation of small airways on histology combined with microCT scan
(A) An example of a MDCT scan of a specimen (left panel) matched with a photograph of the corresponding lung slice on which the circled area indicates the region that was subsequently used for microCT and histology. This allowed for comparison of the microCT to the histology of the same airway. By matching a microCT image to a histological section, this technique enabled identification of terminal (TB), preterminal (TB-1), and pre-preterminal (TB-2) bronchioles on histology. (B) Representative cross-sections of TB-1 in control and COPD. Scale bar indicates 0.5mm. (C, D & E) show histological measurements of relatively circular bronchioles (9 TB, 11 TB-1, and 5 TB-2 in control and 8 TB, 11 TB-1, and 5 TB-2 in COPD) (C) Basement membrane length, (D) Degree of airway narrowing (E) and Wall thickness. The degree of airway narrowing was calculated as; 1 – (measured luminal area) / (calculated area enclosed by the basement membrane in hypothetical maximally dilated airways). “All” on the x-axis indicates the data when combining all circular bronchioles including TB-2, TB-1, and TB (n=25 in control and n=24 in COPD). *p<0.05 and **p<0.01.
Figure 4.
Figure 4.. A combined analysis of immunohistochemistry and microCT images to assess infiltration of immune cells and structural changes in small airways
(A) Representative immunohistochemistry with CD79a antibody (B cell marker, indicated by a yellow arrow) in preterminal bronchiole (TB-1) of control and COPD. Scale bar indicates 0.5mm. TB and TB-2 indicate terminal and pre-preterminal bronchioles. (B and C) Volume fractions (Vv) of the airway wall occupied by immune cells using all circular and non-circular bronchioles (15–16 TB, 15–17 TB-1, and 9–10 TB-2 in control and 17–18 TB, 15–16 TB-1, and 13 TB-2 in COPD). (D) A significantly greater B cell infiltration into the walls of TB1 and TB-2 in COPD samples with mean liner intercept (Lm) <1000 μm (n=14) and those with Lm ≥1000 μm (n=15) compared to controls (n=24). (E) and (F) show the relationships of Vv of B cells in the wall of TB-1 and TB-2 with the number of alveolar attachments per airway (r=−0.39, p=0.04) and with the number of alveolar attachments per mm of outer perimeter (r=−0.45, p=0.02), respectively. *p<0.05 and **p<0.01.

References

    1. Weibel ER. Morphometry of the Human Lung. Springer Verlag and Academic Press, Heidelberg-New York: 1963.
    1. Green M How big are the bronchioles?. St Thomas Hospital gazette 1965: 63: 136–139.
    1. Macklem PT, Mead J. Resistance of central and peripheral airways measured by a retrograde catheter. J Appl Physiol 1967: 22(3): 395–401. - PubMed
    1. Hogg JC, Macklem PT, Thurlbeck WM. Site and nature of airway obstruction in chronic obstructive lung disease. N Engl J Med 1968: 278(25): 1355–1360. - PubMed
    1. Mead J The lung’s “quiet zone”. N Engl J Med 1970: 282(23): 1318–1319. - PubMed

Publication types

MeSH terms