. 2018 Feb 14;9(2):240.
doi: 10.1038/s41419-018-0296-4.

Pyruvate kinase M2 regulates photoreceptor structure, function, and viability

Affiliations

Pyruvate kinase M2 regulates photoreceptor structure, function, and viability

Ammaji Rajala et al. Cell Death Dis. .

Abstract

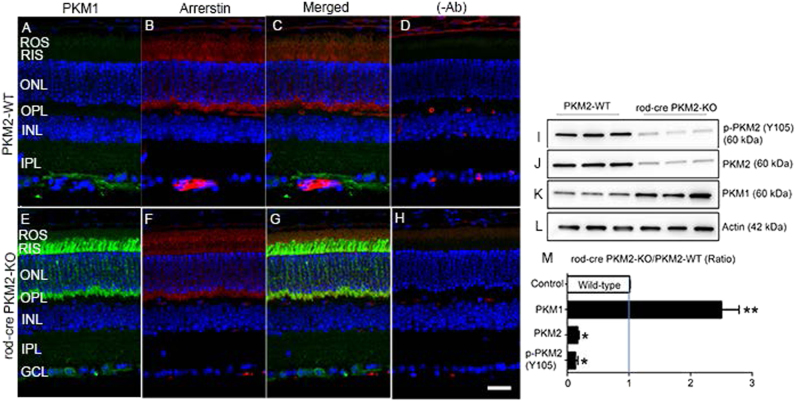
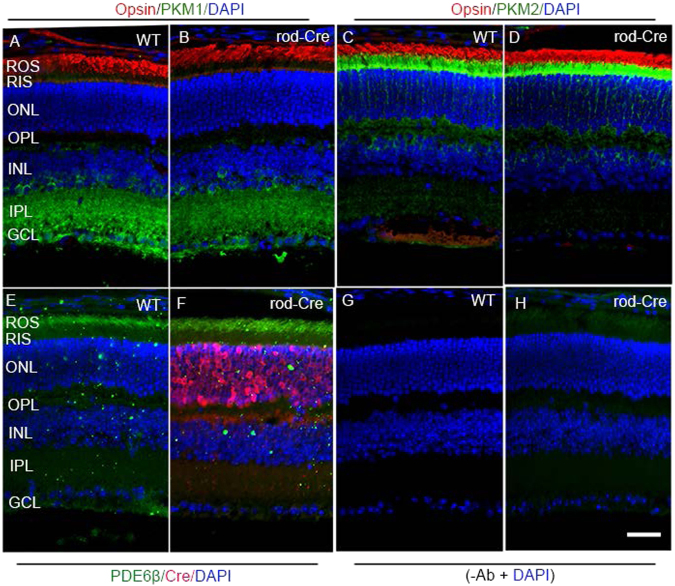
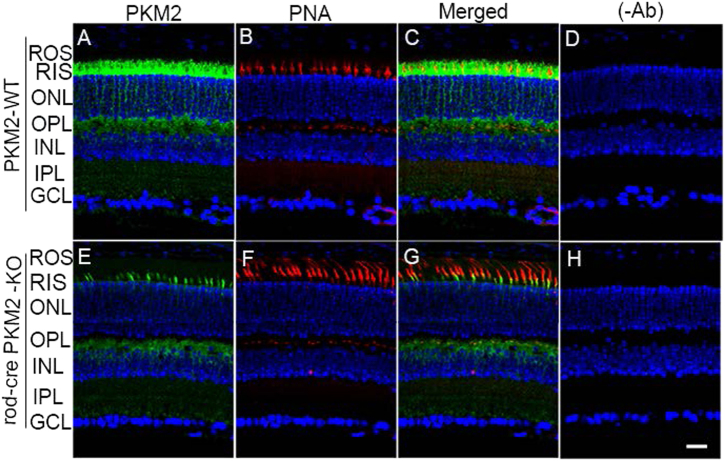
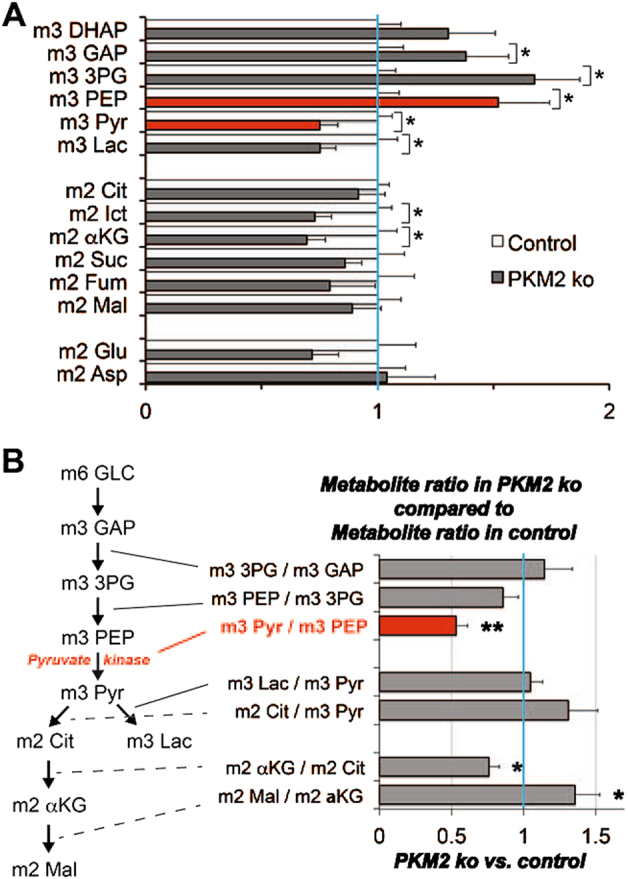
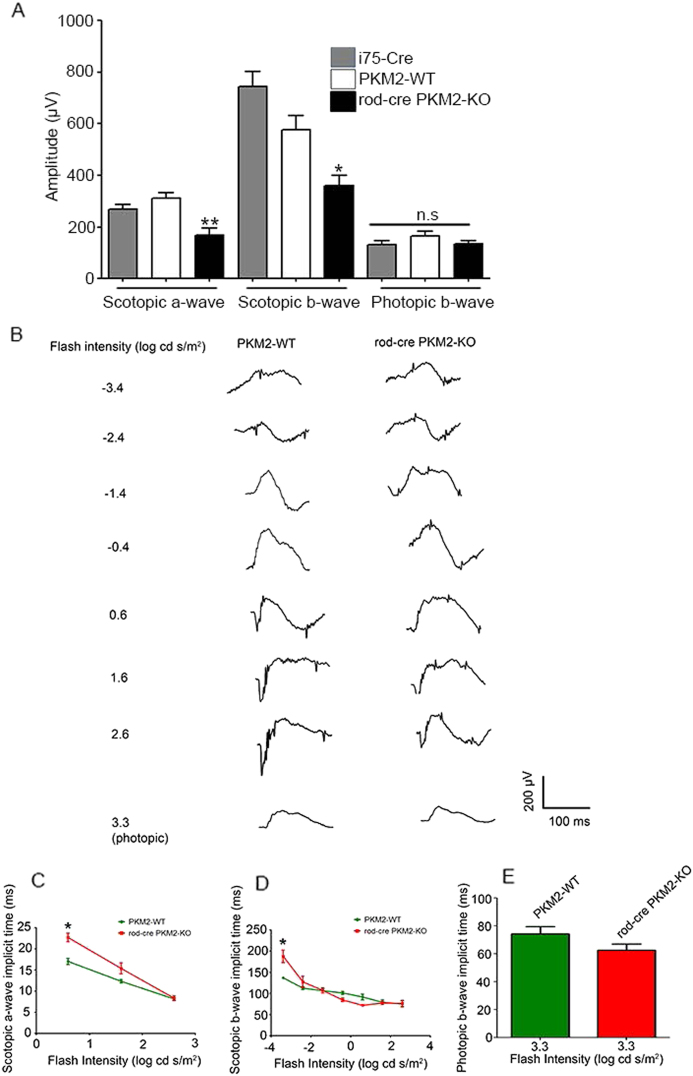
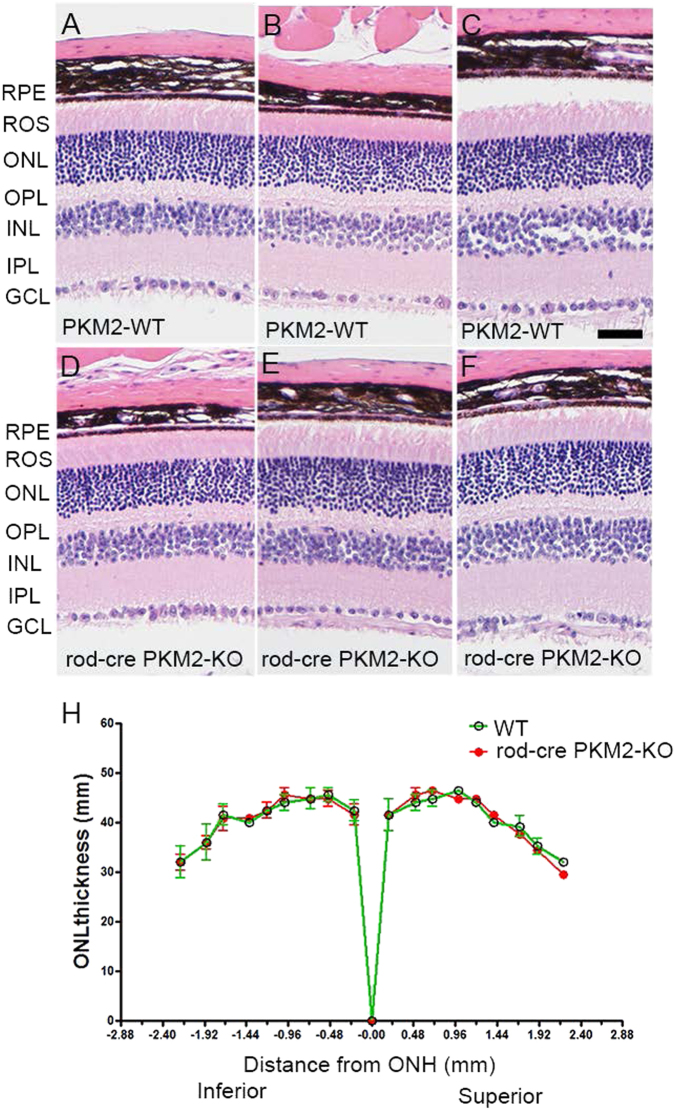
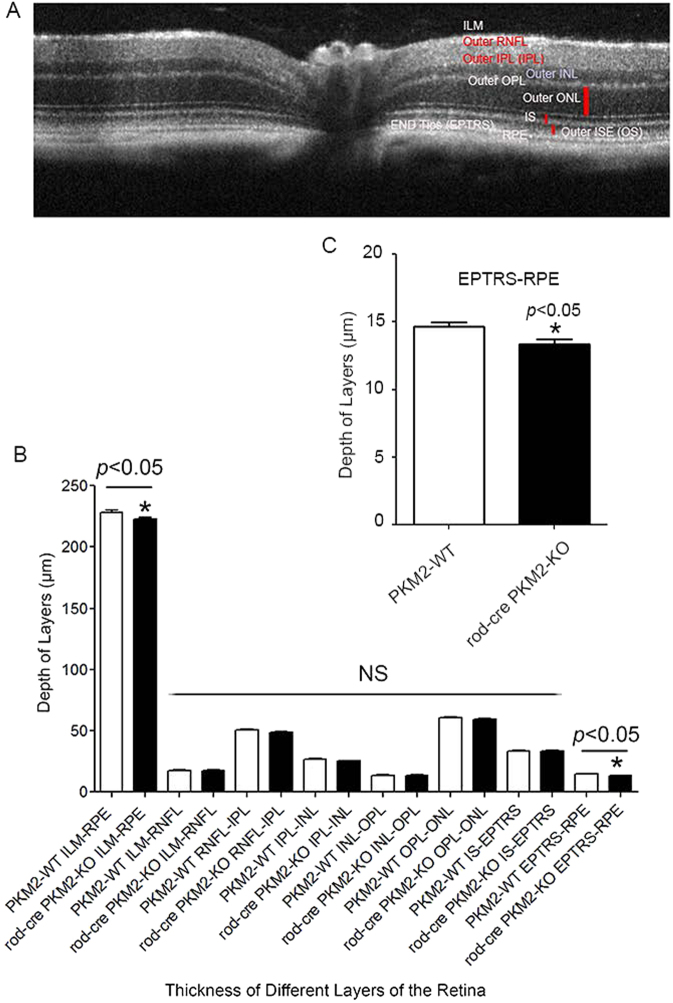
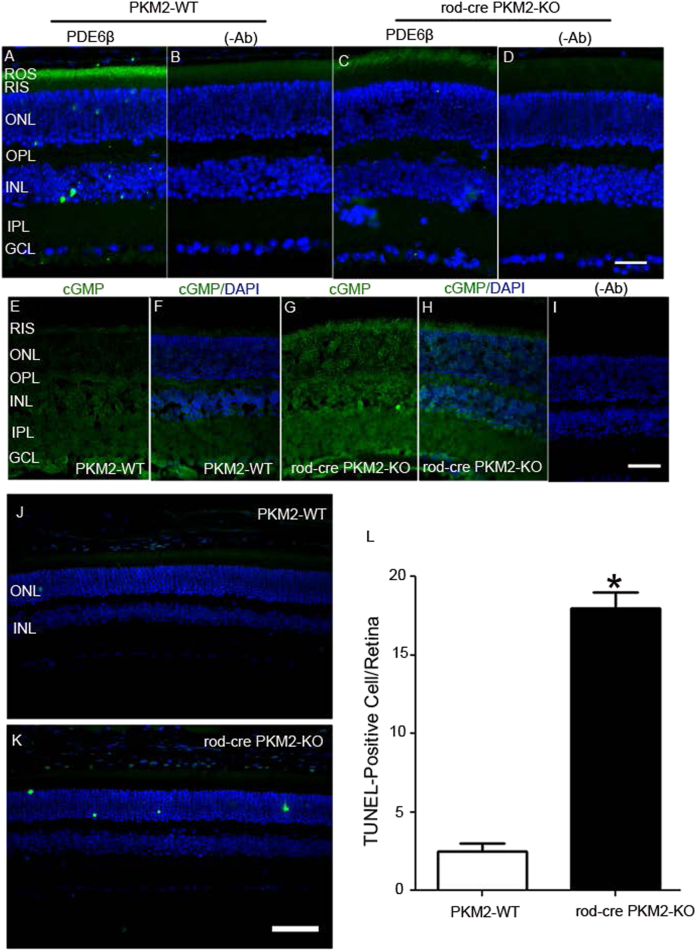
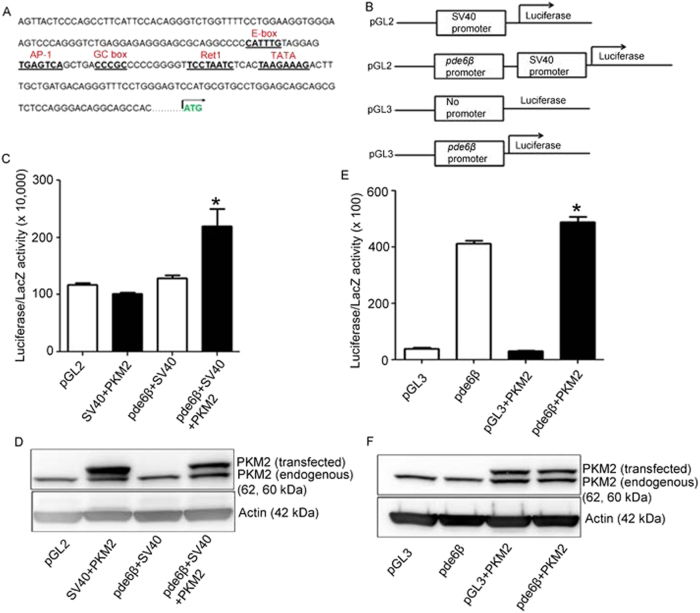
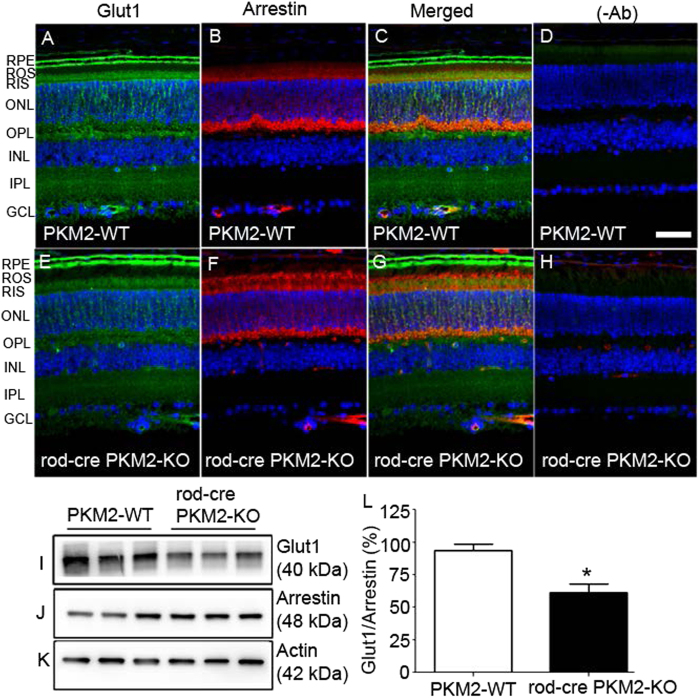
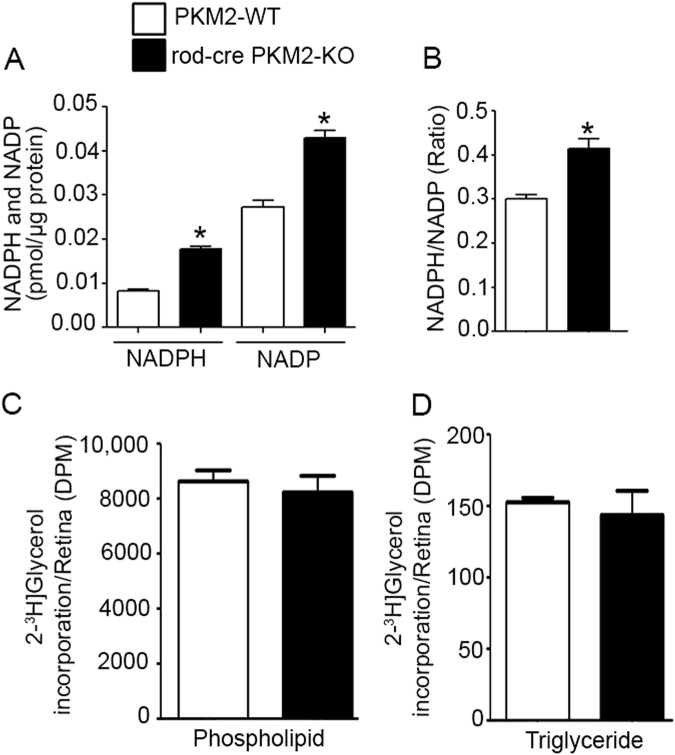
Pyruvate kinase M2 (PKM2) is a glycolytic enzyme that is expressed in cancer cells. Its role in tumor metabolism is not definitively established, but investigators have suggested that regulation of PKM2 activity can cause accumulation of glycolytic intermediates and increase flux through the pentose phosphate pathway. Recent evidence suggests that PKM2 also may have non-metabolic functions, including as a transcriptional co-activator in gene regulation. We reported previously that PKM2 is abundant in photoreceptor cells in mouse retinas. In the present study, we conditionally deleted PKM2 (rod-cre PKM2-KO) in rod photoreceptors and found that the absence of PKM2 causes increased expression of PKM1 in rods. Analysis of metabolic flux from U-13C glucose shows that rod-cre PKM2-KO retinas accumulate glycolytic intermediates, consistent with an overall reduction in the amount of pyruvate kinase activity. Rod-cre PKM2-KO mice also have an increased NADPH availability could favor lipid synthesis, but we found no difference in phospholipid synthesis between rod-cre PKM2 KO and PKM2-positive controls. As rod-cre PKM2-KO mice aged, we observed a significant loss of rod function, reduced thickness of the photoreceptor outer segment layer, and reduced expression of photoreceptor proteins, including PDE6β. The rod-cre PKM2-KO retinas showed greater TUNEL staining than wild-type retinas, indicating a slow retinal degeneration. In vitro analysis showed that PKM2 can regulate transcriptional activity from the PDE6β promoter in vitro. Our findings indicate that both the metabolic and transcriptional regulatory functions of PKM2 may contribute to photoreceptor structure, function, and viability.


Conflict of interest statement

The authors declare that they have no conflict of interest.

Figures

Fig. 1
Fig. 1. Immunofluorescence analysis of PKM2 in wild-type and rod-cre PKM2-KO mice.
Prefer-fixed sections of wild-type a- d and rod-cre PKM2-KO eh mouse retinas were subjected to immunofluorescence with anti-PKM2 a, e and anti-opsin b, f. c, g Merged images of PKM2 and opsin. d, h Omission of primary antibodies. GCL, ganglion cell layer; INL, inner nuclear layer; IPL, inner plexiform layer; ONL, outer nuclear layer; OPL, outer plexiform layer; RIS, rod inner segment; ROS, rod outer segments. Scale bar = 50 μm
Fig. 2
Fig. 2. Immunofluorescence analysis of PKM1 in wild-type and rod-cre PKM2-KO mice.
Prefer-fixed sections of wild-type a- d and rod-cre PKM2-KO eh) mouse retinas were subjected to immunofluorescence with anti-PKM1 a, e and anti-arrestin b, f antibodies. c, g Merged images of PKM1 and arrestin. d, h Omission of primary antibodies. GCL, ganglion cell layer; INL, inner nuclear layer; IPL, inner plexiform layer; ONL, outer nuclear layer; OPL, outer plexiform layer; RIS, rod inner segment; ROS, rod outer segments. Scale bar = 50 μm. Retinal homogenates (5.0 µg protein) from wild-type and rod-cre PKM2 KO mice were subjected to immunoblot analysis with anti-pPKM2 (Y105) i, anti-PKM2 j, anti-PKM1 k, and anti-actin l antibodies. We normalized the protein expression/phosphorylation to actin m and then calculated the ratios (rod-cre PKM2-KO/PKM2-WT). Data are mean ± SEM (n = 3). *p < 0.004, **p < 0.001
Fig. 3
Fig. 3. Expression of PKM1, PKM2, and rod photoreceptor marker proteins opsin and PDE6β in wild-type and rod-cre mice.
Prefer-fixed sections of wild-type a, c, e, g and rod-cre b, d, f, h mouse retinas were subjected to immunofluorescence with anti-PKM1 a, b and anti-PKM2 c, d, anti-opsin ad, anti-PDE6β e, f, and anti-Cre e, f antibodies. a, b Merged images of PKM1 and opsin. c, d Merged images of PKM2 and opsin. e, f Merged images of PDE6β and Cre. g, h Omission of primary antibodies. GCL, ganglion cell layer; INL, inner nuclear layer; IPL, inner plexiform layer; ONL, outer nuclear layer; OPL, outer plexiform layer; RIS, rod inner segments; ROS, rod outer segments. Scale bar = 50 μm
Fig. 4
Fig. 4. Cone photoreceptor integrity in rod-cre PKM2 KO mice.
Prefer-fixed sections of wild-type a- d and rod-cre PKM2-KO eh mouse retinas were subjected to immunofluorescence with anti-PKM2 a, e and PNA b, f. c, g Merged images of PKM2 and PNA. d, h Omission of primary antibody. GCL, ganglion cell layer; INL, inner nuclear layer; IPL, inner plexiform layer; ONL, outer nuclear layer; OPL, outer plexiform layer; ROS, rod outer segments; RIS, rod inner segment. Scale bar = 50 μm
Fig. 5
Fig. 5. The effect of rod-specific PKM2-deficiency and PKM1 upregulation on metabolic flux in mouse retinas.
Mouse retinas were isolated and incubated with 5 mM U-13C glucose for 5 min. Metabolites were extracted and analyzed by GC–MS. a Comparison of the amounts of labeled metabolites in PKM2-KO vs. control retinas shows that glycolytic intermediates accumulated before the reaction catalyzed by pyruvate kinase. b Comparison of the ratios of substrates and products at various points in glycolysis and the TCA cycle shows that only the step catalyzed by pyruvate kinase is significantly affected in the rod-specific PKM2-KO retinas. Data are mean ± SEM (n =  8). **p < 0.001, *p < 0.05
Fig. 6
Fig. 6. Function of rod-cre PKM2-KO mouse retina.
Scotopic a-wave, scotopic b-wave, and photopic b-wave electroretinographic analysis of retinas from 5-month-old i75-Cre, wild-type (PKM2-WT), and rod-cre PKM2-KO mice a. Scotopic a-and b-wave amplitudes were measured at a flash intensity of 2.6 log cd s/m2, whereas photopic b-wave amplitude was measured at a flash intensity of 3.3 log cd s/m2. Data are mean ± SEM (n = 6). **p < 0.0022, *p < 0.0138. Representative raw ERG traces recorded from 5-month-old PKM2-WT and rod-cre PKM2-KO mice b. Isolated rod ERG measured with a stimulus below the operative range of cones at flash intensities of − 3.4, − 2.4, − 1.4, − 0.4, 0.6, 1.6, and 2.6 log cd s/m2. Isolated cone ERG measured at a flash intensity of 3.3 log cd s/m2, at which rods were saturated. Scotopic a-wave, scotopic b-wave, and photopic b-wave implicit time intensity-response for PKM2-WT and rod-cre PKM2-KO mice c-e. Implicit times for scotopic a-wave were calculated at flash intensities of 0.6, 1.6, and 2.6 log cd s/m2. Implicit times for scotopic b-wave were calculated at flash intensities of − 3.4, − 2.4, − 1.4, − 0.4, 0.6, 1.6, and 2.6 log cd s/m2. Implicit times for photopic b-wave was calculated at a flash intensity of 3.3 log cd s/m2. Data are mean ± SEM (n = 6). *p < 0.001
Fig. 7
Fig. 7. Morphology of rod-cre PKM2-KO retina and assessment of rod outer segment integrity.
Morphologic examination of three independent mouse retinas from 5-month-old wild-type ac and rod-cre PKM2-KO mice df. GCL, ganglion cell layer; INL, inner nuclear layer; IPL, inner plexiform layer; ONL, outer nuclear layer; OPL, outer plexiform layer; RPE, retinal pigment epithelium; ROS, rod outer segments. Scale bar = 50 μm. Quantification of morphological changes h. Plots of total retinal thickness in the inferior and superior regions of the retinas of wild-type, and rod-cre PKM2-KO mice are shown. Values are mean ± SEM (n = 3). ONH, optic nerve head
Fig. 8
Fig. 8. Morphological architecture of retina using optical coherence tomography (OCT).
Retinal thickness of each layer from wild-type and rod-cre PKM2-KO mice was assessed by OCT. a Morphological architecture of the retina, showing individual layers. These layers include the inner limiting membrane (ILM), outer retinal nerve fiber layer (RNFL), outer inner plexiform layer (IPL), outer inner nuclear layer (INL), outer plexiform layer (OPL), outer nuclear layer (ONL), inner segment ellipsoid (IS), outer segment ellipsoid (OS), end tips (EPTRS), and retinal pigment epithelium (RPE). b Quantitative OCT analysis of the depth of each retinal layer of wild-type and rod-cre PKM2-KO mice. Inset c thickness between EPTRS and RPE in wild-type and rod-cre PKM2-KO mice. Data are mean ± SEM (n = 14). *p < 0.05
Fig. 9
Fig. 9. Expression levels of photoreceptor-specific proteins in wild-type and rod-cre PKM2-KO mice.
Retinal homogenates (5.0 µg protein) from three independent wild-type and rod-cre PKM2 KO mice were subjected to immunoblot analysis with anti-opsin a, anti-arrestin b, anti-Tα c, anti-PDE6β d, anti-PDEγ e, anti-CNGA1 f, anti-RGS9-1 g, anti-Gβ5L/S h, anti-R9AP i, anti-M-opsin j, anti-cone-arrestin k, and anti-actin l antibodies. We normalized the protein expression to rod arrestin m and then calculated the ratios (rod-cre PKM2-KO/PKM2-WT). Data presented as a ratio are mean ± SEM (n = 3). **p<0.01, *p < 0.02
Fig. 10
Fig. 10. Decreased PED6 β, increased cGMP, and increased TUNEL staining in rod-cre PKM2 KO mouse retinas.
Prefer-fixed sections of wild-type a and rod-cre PKM2-KO c mouse retinas were subjected to immunofluorescence with anti-PDE6β a, c antibody. b, d Omission of primary antibody. GCL, ganglion cell layer; INL, inner nuclear layer; IPL, inner plexiform layer; ONL, outer nuclear layer; OPL, outer plexiform layer; RIS, rod inner segments; ROS, rod outer segments. Scale bar = 50 μm. Cryosections of wild-type e, f and rod-cre PKM2-KO g, h mouse retinas were subjected to immunofluorescence with anti-cGMP eh antibody. f, h cGMP (green)/DAPI (blue) staining. i Omission of primary antibody. Prefer-fixed retinal sections of PKM2-WT and rod-cre PKM2-KO mice were examined for cell death with in situ localization of apoptosis using TUNEL j, k. TUNEL-positive cells were counted on the entire retina l. Data are mean ± SEM, (n = 3). *p < 0.001
Fig. 11
Fig. 11. PKM2 regulates pde6β promoter activity in vitro:
Sequence of the human pde6β proximal promoter region showing the potential regulatory elements: E box, AP-1, GC box, Ret1, and TATA box are labeled a. The regulatory region constructs used in this study are: pGL2-SV40-luciferase, pGL2-pde6β-SV40-luciferase, pGL3-luciferase and pGL3- pde6β-luciferase b. Empty vectors or promoter constructs were transfected into HEK-293T cells in the presence of β-galactosidase, and either flag-tagged PKM2 or absence of flag-tagged PKM2. Forty-eight hours later, cells were lysed and the luciferase and β-galactosidase activity were measured, and the luciferase activity was normalized to β-galactosidase activity c, e. Remaining lysates were used for immunoblot analysis with Flag (transfected), PKM2 (endogenous) and actin antibodies d, f. Data are mean ± SEM, (n = 3). *p < 0.05
Fig. 12
Fig. 12. Effect of PKM2 loss on glucose transporter Glut1 expression in the retina.
Prefer-fixed sections of wild-type a- d and rod-cre PKM2-KO eh mouse retinas were subjected to immunofluorescence with anti-Glut1 a, c, e, g and anti-arrestin b, c, f, g antibodies. c, g Merged images of Glut1 and arrestin. d, h Omission of primary antibodies. GCL, ganglion cell layer; INL, inner nuclear layer; IPL, inner plexiform layer; ONL, outer nuclear layer; OPL, outer plexiform layer; RIS, rod inner segments; RPE, retinal pigment epithelium; ROS, rod outer segments. Scale bar = 50 μm. Retinal proteins prepared from three independent wild-type and rod-cre PKM2-KO mice were subjected to immunoblot analysis with anti-Glut1 i, anti-arrestin j, and anti-actin k antibodies. Densitometric analysis of immunoblots was performed in the linear range of detection. Absolute values were then normalized to arrestin l. Data are mean ± SEM (n = 3). *p < 0.01. The normalized PKM2 wild-type control was set as 100%
Fig. 13
Fig. 13. Determination of NADPH and NADP levels in wild-type and rod-cre PKM2-KO mouse retinas.
Mouse retinal tissues from wild-type and rod-cre PKM2-KO mice were used to measure NADPH and NADP levels a and their ratio was presented b. Data are mean ± SEM (n = 3). *p < 0.05. PKM2-WT and rod-cre PKM2-KO mouse retinas were placed in Ringer solution and incubated in the presence of radiolabeled [2-3H] glycerol for 45 min at room temperature. Total lipids were extricated and subjected to TLC to separate phospholipids c and triglycerides d followed by counting the radioactivity. Data mean ± SEM (n = 4)

References

    1. Warburg O. On respiratory impairment in cancer cells. Science. 1956;124:269–270. - PubMed
    1. Warburg O. On the origin of cancer cells. Science. 1956;123:309–314. doi: 10.1126/science.123.3191.309. - DOI - PubMed
    1. Christofk HR, et al. The M2 splice isoform of pyruvate kinase is important for cancer metabolism and tumour growth. Nature. 2008;452:230–233. doi: 10.1038/nature06734. - DOI - PubMed
    1. Gruning NM, et al. Pyruvate kinase triggers a metabolic feedback loop that controls redox metabolism in respiring cells. Cell. Metab. 2011;14:415–427. doi: 10.1016/j.cmet.2011.06.017. - DOI - PMC - PubMed
    1. Iqbal MA, et al. Insulin enhances metabolic capacities of cancer cells by dual regulation of glycolytic enzyme pyruvate kinase M2. Mol. Cancer. 2013;12:72. doi: 10.1186/1476-4598-12-72. - DOI - PMC - PubMed

Publication types

MeSH terms