. 2018 Feb 14;8(1):2977.
doi: 10.1038/s41598-018-20834-y.

Plasma and urinary metabolomic profiles of Down syndrome correlate with alteration of mitochondrial metabolism

Affiliations

Plasma and urinary metabolomic profiles of Down syndrome correlate with alteration of mitochondrial metabolism

Maria Caracausi et al. Sci Rep. .

Abstract

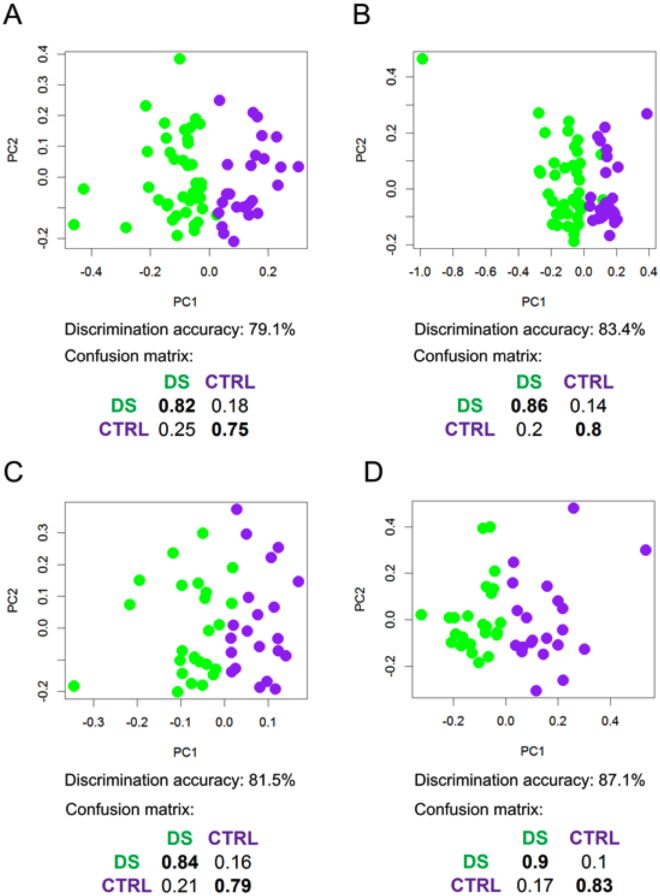
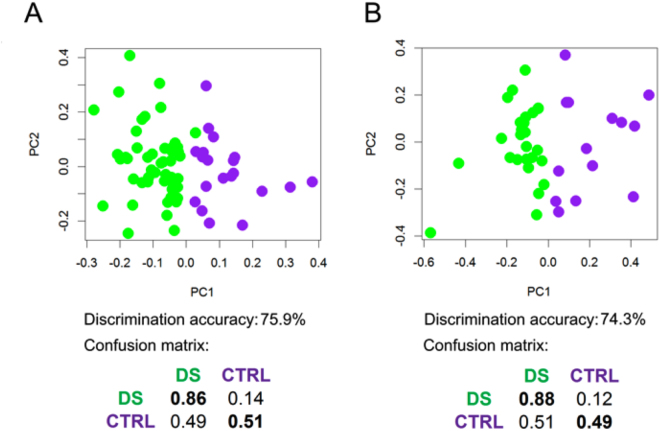
Down syndrome (DS) is caused by the presence of a supernumerary copy of the human chromosome 21 (Hsa21) and is the most frequent genetic cause of intellectual disability (ID). Key traits of DS are the distinctive facies and cognitive impairment. We conducted for the first time an analysis of the Nuclear Magnetic Resonance (NMR)-detectable part of the metabolome in plasma and urine samples, studying 67 subjects with DS and 29 normal subjects as controls selected among DS siblings. Multivariate analysis of the NMR metabolomic profiles showed a clear discrimination (up to of 80% accuracy) between the DS and the control groups. The univariate analysis of plasma and urine revealed a significant alteration for some interesting metabolites. Remarkably, most of the altered concentrations were consistent with the 3:2 gene dosage model, suggesting effects caused by the presence of three copies of Hsa21 rather than two: DS/normal ratio in plasma was 1.23 (pyruvate), 1.47 (succinate), 1.39 (fumarate), 1.33 (lactate), 1.4 (formate). Several significantly altered metabolites are produced at the beginning or during the Krebs cycle. Accounting for sex, age and fasting state did not significantly affect the main result of both multivariate and univariate analysis.


Conflict of interest statement

The authors declare no competing interests.

Figures

Figure 1
Figure 1
PLS-CA analysis of plasma samples. Score plots, PC1 vs PC2, and corresponding confusion matrices. In the score plot, each dot represents a different plasma sample. Green dots: DS samples; purple dots: healthy controls. All samples (DS, n = 41; CTRL, n = 25). (A) 1Dpresat CPMG spectra; discrimination accuracy: 79.1% (95% CI, 78.6–79.6%); sensitivity: 82.0% (95% CI, 81.3–82.4%); specificity: 75.0% (95% CI, 74.5–78.9%). (B) 1Dpresat NOESY spectra; discrimination accuracy: 83.4% (95% CI, 83.0–83.8%); sensitivity: 85.7% (95% CI, 85.2–86.2%); specificity: 80.0% (95% CI, 79.0–80.3%). Samples from fasting subjects (DS, n = 25; CTRL, n = 21). (C) 1Dpresat CPMG spectra; discrimination accuracy: 81.5% (95% CI, 80.9–82.0%); sensitivity: 83.9% (95% CI, 83.2–84.6%); specificity: 78.6% (95% CI, 77.8–79.5%). (D) and 1Dpresat NOESY spectra; discrimination accuracy: 87.1% (95% CI, 86.7–87.6%); sensitivity: 90.3% (95% CI, 89.8–90.9%); specificity: 83.3% (95% CI, 82.5–84.1%).
Figure 2
Figure 2
PLS-CA analysis of urine samples. 1Dpresat NOESY spectra. Score plot, PC1 vs PC2, and corresponding confusion matrices. In the score plot, each dot represents a different urine sample. Green dots: DS samples; purple dots: healthy controls. (A) All samples (DS, n = 51; CTRL, n = 20); discrimination accuracy: 75.9% (95% CI, 75.5–76.2%); sensitivity: 85.6% (95% CI, 85.2–86.1%); specificity: 50.9% (95% CI, 49.9–51.8%). (B) Samples from fasting subjects (DS, n = 26; CTRL, n = 14); discrimination accuracy: 74.3% (95% CI, 73.7–74.8%); sensitivity: 87.9% (95% CI, 87.3–88.5%); specificity: 48.9% (95% CI, 47.7–50.2%).
Figure 3
Figure 3
The “Lejeune Machine”, representing human metabolism as a mechanical machine, with highlighting of metabolites (gears) with an altered concentration in DS plasma. The original Figure is a drawing by Jérôme Lejeune and it has been obtained thanks to courtesy of Mme Birthe Lejeune and used with her kind permission. The drawing has been modified here by the authors by means of coloring. Red = increased (at p < 0.05 and/or with a 1.3–1.7 DS/CTRL ratio); orange = increased, although at p ≥ 0.05 and not within the 1.3–1.7 ratio range; blue = decreased (at p < 0.05 and/or with a 0.58–0.76 DS/ CTRL ratio); green = decreased, although at p ≥ 0.05 and not within the 0.58–0.76 ratio range; yellow/violet = increased/decreased, according to literature data, respectively–,. S-adenosylhomocysteine and S-adenosylmethionine plasma level were decreased according to Pogribna and Coll., and increased according to Obeid and Coll.. The yellow gear above the “Krebs” gear represents cystathionine. Other explanations in the text.

References

    1. Hickey F, Hickey E, Summar KL. Medical update for children with Down syndrome for the pediatrician and family practitioner. Adv. Pediatr. 2012;59:137–157. doi: 10.1016/j.yapd.2012.04.006. - DOI - PubMed
    1. Gardiner K, et al. Down syndrome: from understanding the neurobiology to therapy. J. Neurosci. 2010;30:14943–14945. doi: 10.1523/JNEUROSCI.3728-10.2010. - DOI - PMC - PubMed
    1. Roizen NJ, Patterson D. Down’s syndrome. Lancet. 2003;361:1281–1289. doi: 10.1016/S0140-6736(03)12987-X. - DOI - PubMed
    1. Devlin L, Morrison PJ. Accuracy of the clinical diagnosis of Down syndrome. Ulster Med. J. 2004;73:4–12. - PMC - PubMed
    1. Weijerman ME, de Winter JP. Clinical practice. The care of children with Down syndrome. Eur. J. Pediatr. 2010;169:1445–1452. doi: 10.1007/s00431-010-1253-0. - DOI - PMC - PubMed

Publication types

MeSH terms