. 2018 Feb 14;8(1):3038.
doi: 10.1038/s41598-018-21206-2.

Holographic Traction Force Microscopy

Affiliations

Holographic Traction Force Microscopy

Stanislaw Makarchuk et al. Sci Rep. .

Abstract

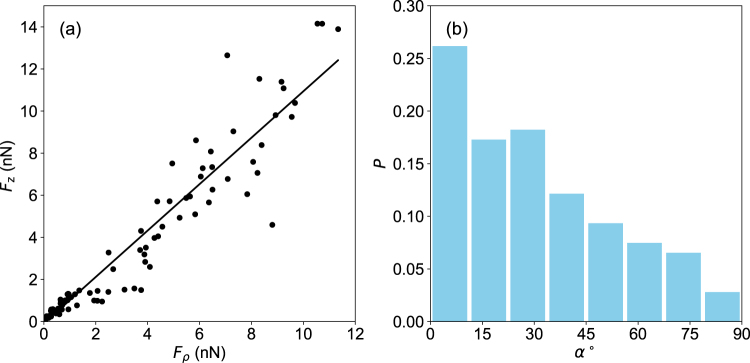
Traction Force Microscopy (TFM) computes the forces exerted at the surface of an elastic material by measuring induced deformations in volume. It is used to determine the pattern of the adhesion forces exerted by cells or by cellular assemblies grown onto a soft deformable substrate. Typically, colloidal particles are dispersed in the substrate and their displacement is monitored by fluorescent microscopy. As with any other fluorescent techniques, the accuracy in measuring a particule's position is ultimately limited by the number of evaluated fluorescent photons. Here, we present a TFM technique based on the detection of probe particle displacements by holographic tracking microscopy. We show that nanometer scale resolutions of the particle displacements can be obtained and determine the maximum volume fraction of markers in the substrate. We demonstrate the feasibility of the technique experimentally and measure the three-dimensional force fields exerted by colorectal cancer cells cultivated onto a polyacrylamide gel substrate.


Conflict of interest statement

The authors declare no competing interests.

Figures

Figure 1
Figure 1
Tracking the positions of particles along x, y and z. (a) Typical image of beads embedded in a polyacrylamide gel and imaged with a LED (141 × 141 pixels, 110 nm per pixel). (b) Knowing the approximate position of the bead (here at the center of the image), a 1D cross correlation (C(r)) can be calculated for both x and y. Then, a polynomial fit (inset) around the maximum of C(r) allows to determine the position with sub-pixel accuracy (see Supplementary Information). (c) 2-sided intensity profiles obtained at different positions along the z axis (position: 6.5 μm, 11.5 μm and 16.5 μm relative our z reference). (d) From these profiles, a Look Up Table (LUT) is built (shown here for 400 z-positions, step size 50 nm) and allows to calculate the parameter φ that varies quadratically with the z position. (e) To determine the z position of a particle (its index in the LUT), squared differences (Δ) are calculated (between the profiles form the LUT and that of the particle of interest). (f) A quadratic adjustment of the phase vs the LUT index around the minimum of Δ allows to determine the z position with a high precision (the index at which the phase vanishes; here 329.84 corresponding to a z position of 16.4925 μm). See and for more details.
Figure 2
Figure 2
Top row: noise measurements for a one micrometer particle embedded in a polyacrylamide gel. (a) Allan deviations (AD, sampling frequency: 20 Hz) measured for all three directions (x: light grey, y: dark grey and z: black). (b) When subtracting reference particles (melted on a glass surface), the AD is strongly reduced at high τ values (0.5 s and above). Note that averaging images (circular markers) or averaging positions (lines) give similar results (see main text). Inset: AD versus vertical distance to the focus. For z, there are optimal positions for tracking (from about 2 to 6 micrometers below the focus). The x and y positions are less sensitive to the diffraction patterns and the AD remains constant. Bottom row: optimal particle volume fraction. (c) Evolution of the volume fraction of successfully tracked particles, ϕtracked (ϕ (black disks, left axis)), and of the relative fraction of successfully tracked particles, νtracked, (grey square symbols, right axis) as a function of the particle volume fraction. (d) Relative fraction of successfully tracked particles as a function of the number of acquired planes, Nplanes, for different particles volume fraction. From top to bottom: ϕ = 0.01%, 0.04%, 0.07%, 0.13%, 0.26%. From 5 to 8 independent regions of size 60 × 60 μm2 are observed at each particle volume fraction. Error bars correspond to one standard deviation of these measurements.
Figure 3
Figure 3
Left: Typical images (550 × 550 pixels) of a cell seeded onto a polyacrylamide gel. Images have been obtained 130 (top image) and 260 (bottom image) minutes after seeding. Shown also (top image, white) are the identification numbers of 14 particles, which have been found below the cell in the time course (600 minutes) of the experiment. Right. Histograms of the visibility (defined in the z intensity profile as the difference between the maximum of the first peak and the minimum of the first valley) when beads are located below (top) and not below (bottom) the cell. At each location, the histograms have been computed when the beads are successfully tracked (light grey) and are either successfully or not successfully tracked (grey). The vertical lines indicate the value of the second quartile of the distributions.
Figure 4
Figure 4
Simulation data. Error of the computed force field, ε2=|FreconstructedFreal||Freal| as a function of the number of points of measurement of the displacement, Nb. The number of points of reconstruction of the force field is 100. The beads are randomly dispersed in an elastic medium (E = 500 Pa) of size 100 × 100 × 50 μm3. A 10 nN point force parallel (a) and normal (b) to the surface is applied at the center of the considered region. The displacement field is computed at each bead position. A random noise of standard deviation σ along the x and y directions and σ along the z direction is added to the displacement field. The force field is computed at the surface of the gel (100 points of calculation), and the error between the computed and the applied forces is computed. Each value is an average over 10 random distribution of particules inside the medium. From black to light grey, the added noise standard deviation is σ = 0, σ = 1 nm, σ = 2 nm and σ = 10 nm.
Figure 5
Figure 5
(a,b) Bright field images of a round (a) and elongated (b) SW480 cell, superimposed with a color plot of the normal stresses exerted by the cell. Positive stresses corresponds to cells pulling the substrate. Scale bars, 10 μm. (c,d) Three-dimensional plot of the forces exerted by a round (c) and elongated (d) cell onto the substrate. The thick black segments represents forces along the x and y directions equal to 10 nN (c) and 1 nN (d).
Figure 6
Figure 6
(a) Normal force Fz as a function of the component of the force in the xy plane, Fρ. Both elongated and round shapes are taken into account. Each point corresponds to the average value of force vectors over an entire field of forces, taken over 170 measurements, of both elongated and round cell shapes. Black line is a linear adjustement of the data. The slope is 1.09. (b) Distribution of the values of the angle α between the main axis of the cell elongation and the major dipole axis of the force field. Major dipole axes were computed with the procedure, described in the text; cell elongation axis are determined by an ellipsoidal adjustement of the cellular boundary. 210 images were analyzed.

References

    1. Wolfenson H, Henis YI, Geiger B, Bershadsky AD. The heel and toe of the cell’s foot: A multifaceted approach for understanding the structure and dynamics of focal adhesions. Cell motility and the cytoskeleton. 2009;66:1017–1029. doi: 10.1002/cm.20410. - DOI - PMC - PubMed
    1. Cukierman E, Pankov R, Stevens DR, Yamada KM. Taking Cell-Matrix Adhesions to the Third Dimension. Science. 2001;294:1708–1712. doi: 10.1126/science.1064829. - DOI - PubMed
    1. Discher DE. Tissue Cells Feel and Respond to the Stiffness of Their Substrate. Science. 2005;310:1139–1143. doi: 10.1126/science.1116995. - DOI - PubMed
    1. Agus, D. B. et al. A physical sciences network characterization of non-tumorigenic and metastatic cells. Scientific Reports3 (2013). - PMC - PubMed
    1. Hochmuth RM. Micropipette aspiration of living cells. Journal of biomechanics. 2000;33:15–22. doi: 10.1016/S0021-9290(99)00175-X. - DOI - PubMed