. 2018 Jan 31:8:2014.
doi: 10.3389/fimmu.2017.02014. eCollection 2017.

Ex Vivo Expanded Human Non-Cytotoxic CD8+CD45RClow/- Tregs Efficiently Delay Skin Graft Rejection and GVHD in Humanized Mice

Affiliations

Ex Vivo Expanded Human Non-Cytotoxic CD8+CD45RClow/- Tregs Efficiently Delay Skin Graft Rejection and GVHD in Humanized Mice

Séverine Bézie et al. Front Immunol. .

Abstract

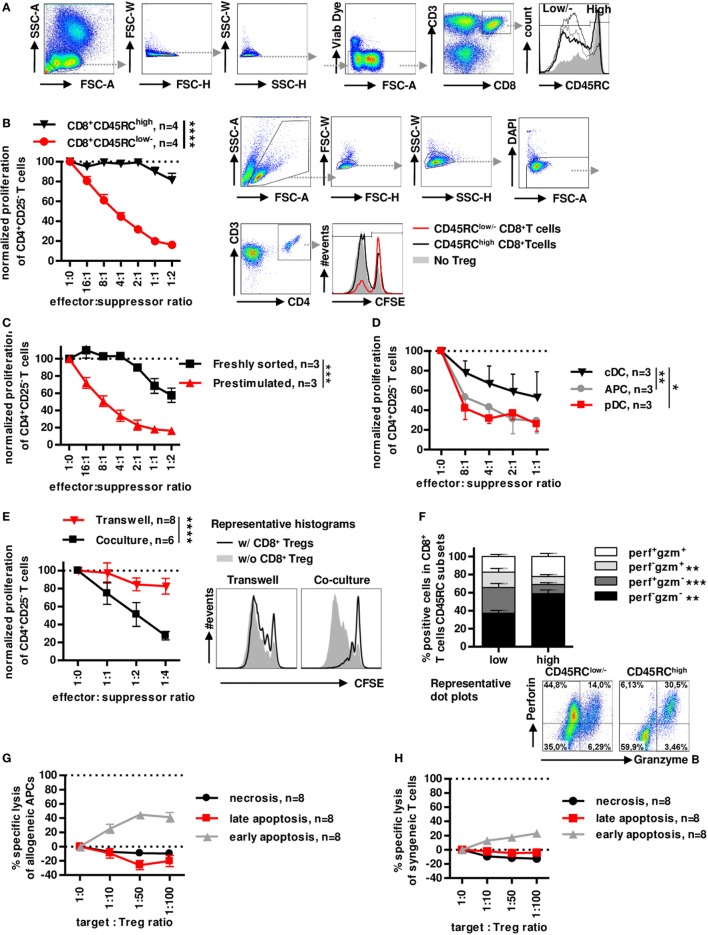
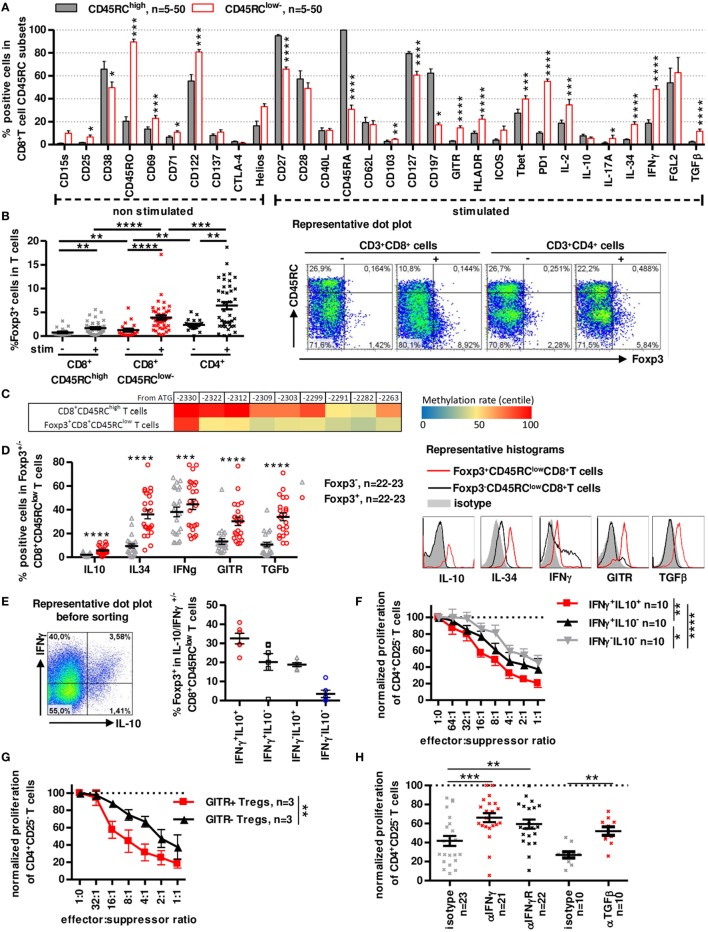
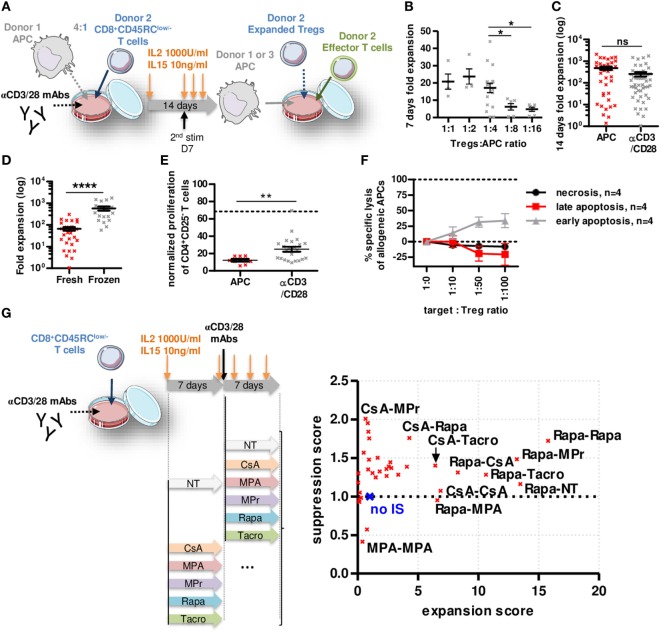
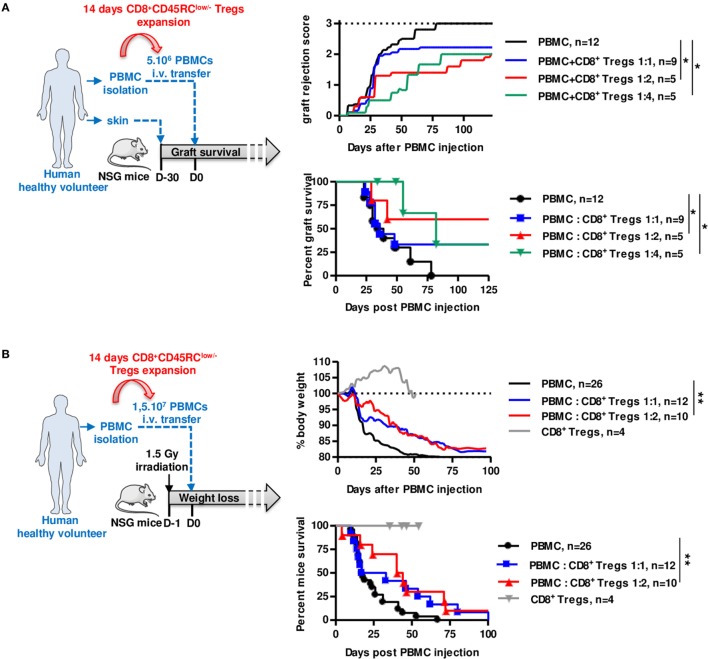
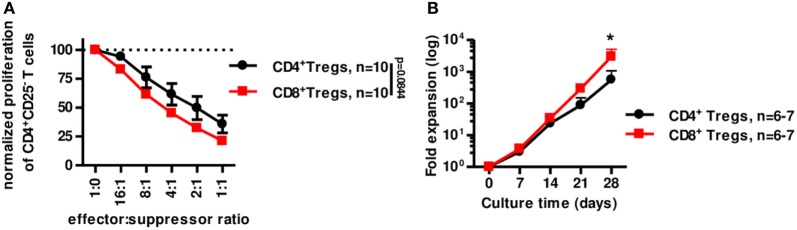
Both CD4+ and CD8+ Tregs play a critical role in the control of immune responses and immune tolerance; however, our understanding of CD8+ Tregs is limited while they are particularly promising for therapeutic application. We report here existence of highly suppressive human CD8+CD45RClow/- Tregs expressing Foxp3 and producing IFNγ, IL-10, IL-34, and TGFβ to mediate their suppressive activity. We demonstrate that total CD8+CD45RClow/- Tregs can be efficiently expanded in the presence of anti-CD3/28 mAbs, high-dose IL-2 and IL-15 and that such expanded Tregs efficiently delay GVHD and human skin transplantation rejection in immune humanized mice. Robustly expanded CD8+ Tregs displayed a specific gene signature, upregulated cytokines and expansion in the presence of rapamycin greatly improved proliferation and suppression. We show that CD8+CD45RClow/- Tregs are equivalent to canonical CD4+CD25highCD127low/- Tregs for suppression of allogeneic immune responses in vitro. Altogether, our results open new perspectives to tolerogenic strategies in human solid organ transplantation and GVHD.

Keywords: GVHD; NSG mice; Treg; cell therapy; graft; tolerance; transplantation.


Figures

Figure 1
Figure 1
Low expression of CD45RC in CD8+ T cells positively correlates with suppressive activity, but not cytotoxicity. PBMCs from healthy volunteers were analyzed for the phenotype of CD8+ Tregs. (A) CD8+ Tregs were defined by gating on lymphocytes morphology, FSC and SSC singlets, living cells, CD3 and CD8 double positive cells, and CD45RClow/− cells including negative and intermediate expression of CD45RC marker. Far right: histogram represents overlay of CD45RC expression by four healthy volunteers. (B) CD8+CD45RClow/− T cells (red lines) and CD8+CD45RChigh T cells (black line) from fresh PBMCs of healthy volunteers were sorted and stimulated overnight with anti-CD3 and anti-CD28 MAbs and tested for suppressive activity on proliferation of syngeneic CD4+CD25 T cells stimulated with allogeneic APCs, in a range of effector:suppressor ratio. Proliferation was normalized to proliferation in the absence of Tregs. Two-way row-matched (RM) ANOVA, n = 4 for each group, ****p < 0.0001. Representative histograms of T CD4+ responder cell proliferation in the presence of CD8+CD45RClow/− (red line) and CD8+CD45RChigh (black line) T cells or without CD8+ T cells (filled gray), after gating on morphology, excluding doublet cells, and gating on living CD4+ T cells. (C) CD8+CD45RClow/− T cells from fresh PBMCs of healthy volunteers were sorted and stimulated overnight with anti-CD3 and anti-CD28 MAbs (red lines) or not (black line) and tested for suppressive activity on proliferation of syngeneic CD4+CD25 T cells stimulated with allogeneic APCs, in a range of effector:suppressor ratio. Proliferation was normalized to proliferation in the absence of Tregs. Two-way RM ANOVA, n = 3 for each group, ***p < 0.001. (D) Plasmacytoid dendritic cells (pDCs), conventional dendritic cells (cDCs), and total APCs were compared as stimulator cells for suppressive activity of Tregs. Proliferation was normalized to proliferation in the absence of Tregs. Two-way RM ANOVA, n = 3, *p < 0.05, **p < 0.01. (E) CD8+CD45RClow/− Tregs were sorted, stimulated overnight with anti-CD3 and anti-CD28 MAbs, and compared for suppressive activity when physically separated from responder cells by a 0.4 µm transwell membrane (transwell, n = 8) vs. in contact with responder cells (coculture, n = 6). Proliferation was normalized to proliferation in the absence of Tregs with or without transwell membrane. APCs were added in both compartments. Two-way RM ANOVA, ****p < 0.0001. (F) CD45RClow/− and high CD8+T cells were compared for granzyme and perforin expression after PMA-ionomycine stimulation. Wilcoxon matched-pairs signed rank test two-tailed, n = 15, **p < 0.01, ***p < 0.001. Bottom: Representative dot plots of perforin and granzyme expression in CD45RClow/− (left) and CD45RChigh (right) CD8+ T cells. (G) CD8+CD45RClow/− Tregs were tested for specific lysis of allogeneic APCs in a range of target:Tregs ratio. Necrosis (black line) and late (red line) and early (gray line) apoptosis were defined by annexin V and Dapi labeling after 15 h of coculture. n = 8. (H) CD8+CD45RClow/− Tregs were tested for specific lysis of syngeneic CD4+CD25 T cells in a range of target:Tregs ratio. Necrosis (black line) and late (red line) and early (gray line) apoptosis were defined by Annexin V and Dapi labeling after 15 h of coculture. n = 8.
Figure 2
Figure 2
A distinct subset of human CD8+CD45RClow/− T cells expresses Foxp3 and secretes IFNγ, IL-10, IL-34, and TGFβ to inhibit antidonor immune responses. (A) CD45RClow/− and CD45RChigh subsets of blood CD8+ T cells were analyzed and compared for expression of activation markers, cytokines and Treg-associated markers after a 7 h PMA-ionomycin stimulation where indicated. Wilcoxon matched-pairs signed rank test two-tailed, n = 5–50. (B) Foxp3 expression was analyzed in unstimulated or PMA-ionomycin stimulated CD8+ CD45RClow/− and CD45RChigh T cells and CD4+CD25+CD127low/− Tregs. Wilcoxon matched-pairs signed rank test two-tailed, n = 39, **p < 0.01, ***p < 0.001, ****p < 0.0001. Right: Representative dot plot of Foxp3 and CD45RC staining on T cells. (C) FOXP3 TSDR methylation of stimulated CD8+CD45RClow/Foxp3+ and CD45RChigh T cells. Color coding represents centile percentage methylation. (D) Left. Markers differentially expressed in Foxp3+ vs. Foxp3 CD8+CD45RClow/− T cells. Wilcoxon matched-pairs signed rank test two-tailed, n = 22–23, ***p < 0.001, ****p < 0.0001. Right, Representative histograms of GITR and cytokines (E) Foxp3 expression was analyzed in sorted IFNγ/IL10 producing CD8+CD45RClow/− T cells, purity was >98%. Graph represents mean ± SEM of Foxp3+ cells percentage in IL-10+IFNγ+, IL-10-IFNγ+, IL-10+IFNγ-, and IL-10-IFNγ CD8+CD45RClow/− T cells. Left: Representative dot plot of IFNγ and IL-10 expression in CD8+CD45RClow/− T cells. (F) CD8+CD45RClow/− Tregs were sorted from healthy volunteers fresh blood, stimulated overnight with anti-CD3 and anti-CD28 MAbs, sorted again on IFNγ and IL-10 secretion and tested for suppressive activity in a range of effector:suppressor ratio. Proliferation was normalized to proliferation in the absence of Tregs. Two-way row-matched (RM) ANOVA, n = 10, *p < 0.05, **p < 0.01, ****p < 0.0001. (G) CD8+CD45RClow/− Tregs were sorted from healthy volunteers’ fresh blood, stimulated overnight with anti-CD3 and anti-CD28 MAbs, sorted again on GITR expression and tested for suppressive activity in a range of effector:suppressor ratio. Proliferation was normalized to proliferation in the absence of Tregs. Two-way RM ANOVA, n = 3, **p < 0.01. (H) Blocking Abs to TGFβ, IFNγ, IFNγ-R were added at day 0 of coculture. Proliferation in the presence of freshly sorted CD8+CD45RClow/− Tregs was normalized to proliferation in the absence of Tregs. Wilcoxon matched-pairs signed rank test, two-tailed, left, n = 21–23; right, n = 10, **p < 0.01, ***p < 0.001.
Figure 3
Figure 3
Rapamycin improved non cytotoxic CD8+CD45RClow/− Tregs expansion and function. (A) Model depicting CD8+CD45RClow/− Tregs expansion with allogeneic APCs or anti-CD3/CD28 MAbs at d0, restimulated at d7 with anti-CD3/CD28 MAbs and analyzed at d14. (B) Expansion yield of CD8+CD45RClow/− Tregs was analyzed in a range of Tregs:allogeneic APCs ratio after 7 days culture. Mann–Whitney two-tailed test, n = 6–18, *p < 0.05. (C) CD8+CD45RClow/− Tregs were stimulated at d0 with allogeneic APCs (n = 37) or anti-CD3/CD28 MAbs (n = 49). (D) CD8+CD45RClow/− Tregs were sorted from fresh (n = 31) or thawed PBMCs (n = 18) and compared for expansion fold at d14. (E) CD8+CD45RClow/− Tregs were expanded with allogeneic APCs or anti-CD3/CD28 MAbs for 7 days and tested for suppression on syngeneic CD4+ T cells proliferation at a 1:1 cell ratio compared to fresh CD8+CD45RClow/− Tregs (dotted line). Mann–Whitney two-tailed test **p < 0.01. (F) 7 days APC-expanded CD8+CD45RClow/− Tregs were tested for lysis toward same APCs in a range of target:Tregs ratio. (G) CD8+CD45RClow/− Tregs were expanded for 14 days with anti-CD3/CD28 MAbs supplemented with immunosuppressors or not (NT) and assessed for suppressive activity and expansion yield. Each point represents mean of four independent experiments normalized to Tregs expanded without drug. (no IS, blue cross).
Figure 4
Figure 4
Phenotypic and transcriptomic profiling of CD8+CD45RClow/− Tregs before and after expansion highlight a distinct signature for/of the cell therapy product. (A) CD8+CD45RClow/− Tregs were expanded with anti-CD3/CD28, IL-2, and IL-15 for 14 days and analyzed for expression of activation and exhaustion markers or cytokines and Treg-associated markers after a 7 h PMA-ionomycin stimulation when indicated (n = 3–7) and compared to non-expanded CD8+CD45RClow/− Tregs (n = 5–52). Mann–Whitney two-tailed test, *p < 0.05, **p < 0.01, ***p < 0.001, ****p < 0.0001. (B) CD8+CD45RClow/− Tregs were analyzed for differentiation state basing on CCR7, CD45RA, CD27, and CD28 expression after expansion (“expanded,” n = 5) as compared to before expansion (“fresh,” n = 14), both without stimulation. Mann–Whitney two-tailed test, *p < 0.05, **p < 0.01. (C) Principal component analysis (PCA) of fresh vs. expanded CD8+CD45RClow/− Treg. (D) Volcano plot representation of differential expression between fresh and expanded Tregs. Genes were colored when considered as differentially expressed, with adjusted p-value < 0.05 and two fold change. Using fresh CD8+CD45RClow/− Tregs as a reference, green genes are downregulated and orange genes upregulated. (E) 3′ digital gene expression RNA-sequencing analysis was performed on CD8+CD45RClow/− Tregs before and after expansion for 14 days. Expression levels of differentially expressed genes are presented as a heatmap; low expression levels are in blue, mean expression levels are in white and high expression levels are in red. Individual samples are numbered 1–11.
Figure 5
Figure 5
Expanded CD8+CD45RClow/− Tregs efficiently delay transplant rejection and GVHD in NSG mice. CD8+CD45RClow/− Tregs were expanded with anti-CD3/CD28, IL-2, and IL-15 and tested in models of allograft rejection (A) and GVHD (B) in NSG mice. (A) Left: scheme depicting skin allorejection model. Top: graft survival was scored on macroscopic signs of graft rejection from 0 to 3 (rejection). Two-way row-matched (RM) ANOVA. Bottom: survival of the skin graft. Log Rank (Mantel Cox). (B) Left: scheme depicting GVHD model. Top: body weight loss was scored. Two-way RM ANOVA. Bottom: survival of mice. Log Rank (Mantel Cox). *p < 0.05, **p < 0.01.
Figure 6
Figure 6
CD8+CD45RClow/− Tregs are equivalent to canonical CD4+CD25+CD127low/− Tregs for suppression in vitro but expand more efficiently. (A) CD8+CD45RClow/− Tregs (n = 10) were compared to classical CD4+CD25hiCD127low/− Tregs (n = 10) for suppressive activity in a range of effector:suppressor ratio after overnight anti-CD3 and anti-CD28 MAbs stimulation. Proliferation was normalized to proliferation in the absence of Tregs. Two-way row-matched (RM) ANOVA. (B) CD8+CD45RClow/− Tregs (red line) and CD4+CD25hiCD127low/− Tregs (black line) were sorted from fresh blood of healthy volunteers and compared for expansion yield when stimulated with anti-CD3 and anti-CD28 MAbs, IL-2, and IL-15 from d0 and every 7 days for 28 days. Two-way RM ANOVA test and Bonferroni posttest, *p < 0.05.

References

    1. Nankivell BJ, Borrows RJ, Fung CL, O’Connell PJ, Allen RD, Chapman JR. The natural history of chronic allograft nephropathy. N Engl J Med (2003) 349:2326–33.10.1056/NEJMoa020009 - DOI - PubMed
    1. Moreau A, Alliot-Licht B, Cuturi MC, Blancho G. Tolerogenic dendritic cell therapy in organ transplantation. Transpl Int (2016) 30(8):754–64.10.1111/tri.12889 - DOI - PubMed
    1. Clement M, Guedj K, Andreata F, Morvan M, Bey L, Khallou-Laschet J, et al. Control of the T follicular helper-germinal center B-cell axis by CD8(+) regulatory T cells limits atherosclerosis and tertiary lymphoid organ development. Circulation (2015) 131:560–70.10.1161/CIRCULATIONAHA.114.010988 - DOI - PubMed
    1. Singer BD, King LS, D’Alessio FR. Regulatory T cells as immunotherapy. Front Immunol (2014) 5:46.10.3389/fimmu.2014.00046 - DOI - PMC - PubMed
    1. Ezzelarab MB, Thomson AW. Adoptive cell therapy with Tregs to improve transplant outcomes: the promise and the stumbling blocks. Curr Transplant Rep (2016) 3:265–74.10.1007/s40472-016-0114-9 - DOI - PMC - PubMed