

Beta cell extracellular vesicle miR-21-5p cargo is increased in response to inflammatory cytokines and serves as a biomarker of type 1 diabetes
- PMID: 29445851
- PMCID: PMC5878132
- DOI: 10.1007/s00125-018-4559-5
Beta cell extracellular vesicle miR-21-5p cargo is increased in response to inflammatory cytokines and serves as a biomarker of type 1 diabetes
Abstract
Aims/hypothesis: Improved biomarkers are acutely needed for the detection of developing type 1 diabetes, prior to critical loss of beta cell mass. We previously demonstrated that elevated beta cell microRNA 21-5p (miR-21-5p) in rodent and human models of type 1 diabetes increased beta cell apoptosis. We hypothesised that the inflammatory milieu of developing diabetes may also increase miR-21-5p in beta cell extracellular vesicle (EV) cargo and that circulating EV miR-21-5p would be increased during type 1 diabetes development.
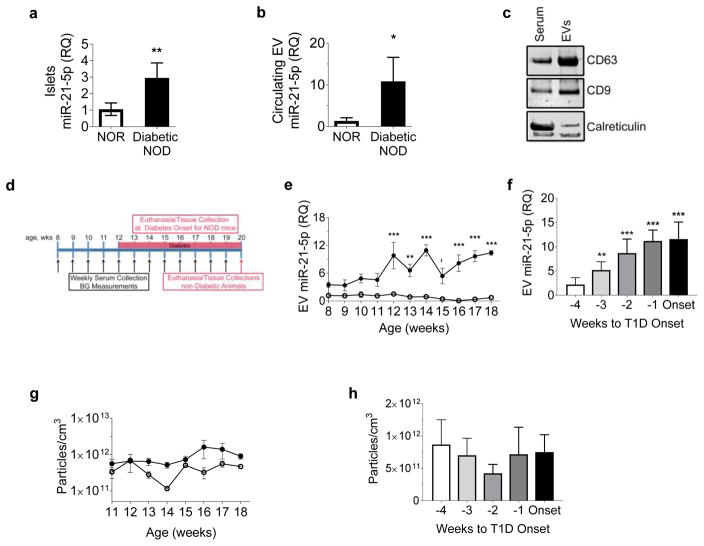
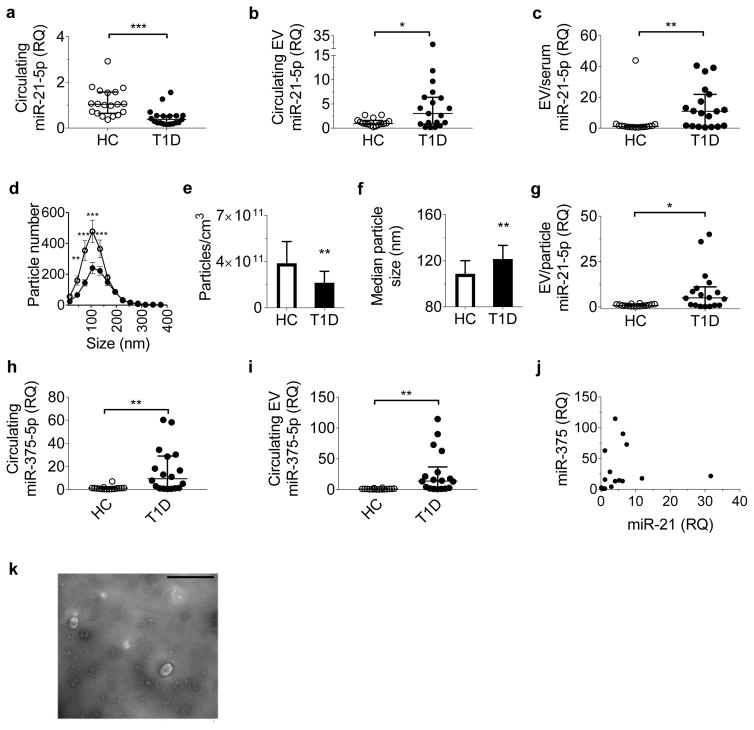
Methods: MIN6 and EndoC-βH1 beta cell lines and human islets were treated with IL-1β, IFN-γ and TNF-α to mimic the inflammatory milieu of early type 1 diabetes. Serum was collected weekly from 8-week-old female NOD mice until diabetes onset. Sera from a cross-section of 19 children at the time of type 1 diabetes diagnosis and 16 healthy children were also analysed. EVs were isolated from cell culture media or serum using sequential ultracentrifugation or ExoQuick precipitation and EV miRNAs were assayed.
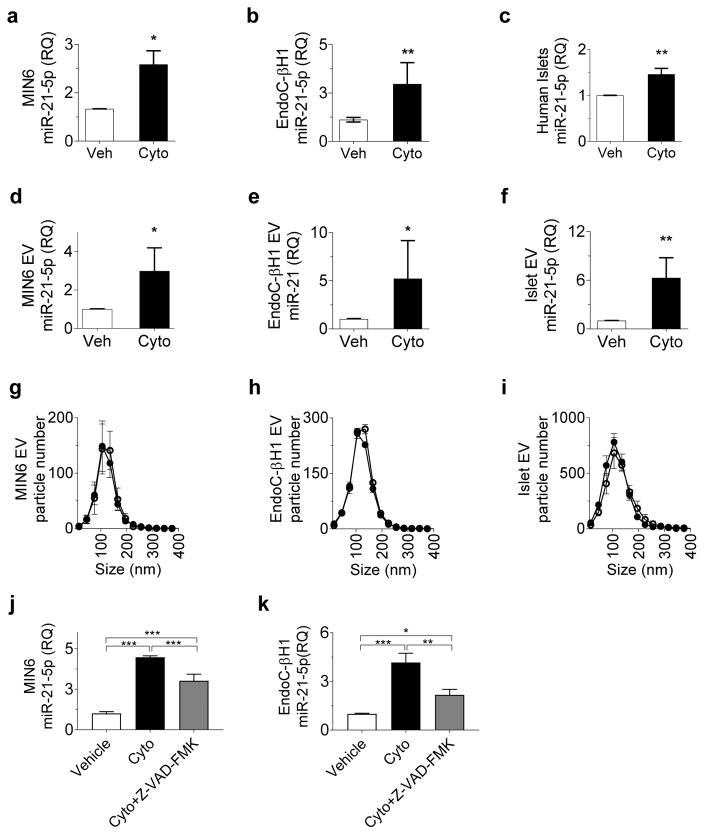
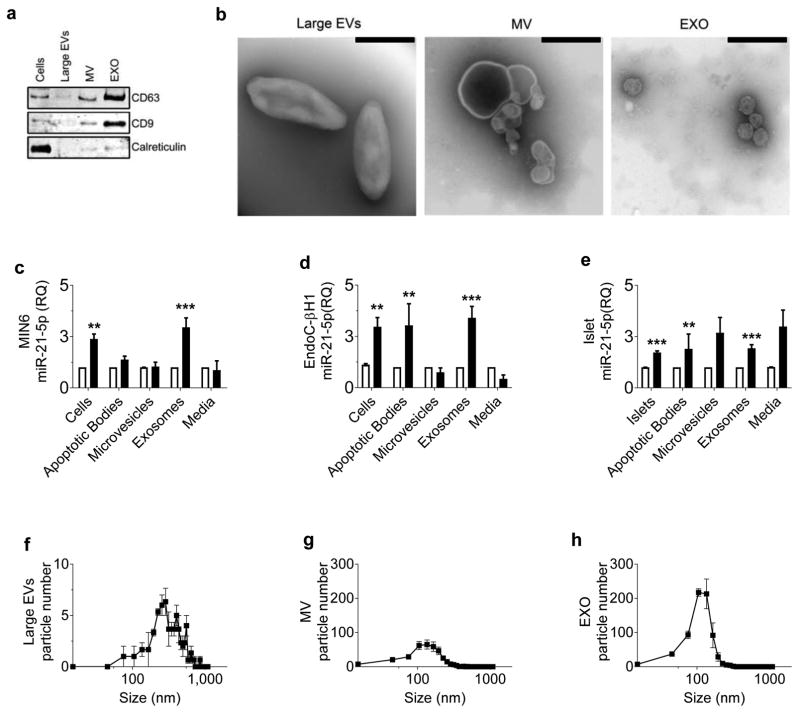
Results: Cytokine treatment in beta cell lines and human islets resulted in a 1.5- to threefold increase in miR-21-5p. However, corresponding EVs were further enriched for this miRNA, with a three- to sixfold EV miR-21-5p increase in response to cytokine treatment. This difference was only partially reduced by pre-treatment of beta cells with Z-VAD-FMK to inhibit cytokine-induced caspase activity. Nanoparticle tracking analysis showed cytokines to have no effect on the number of EVs, implicating specific changes within EV cargo as being responsible for the increase in beta cell EV miR-21-5p. Sequential ultracentrifugation to separate EVs by size suggested that this effect was mostly due to cytokine-induced increases in exosome miR-21-5p. Longitudinal serum collections from NOD mice showed that EVs displayed progressive increases in miR-21-5p beginning 3 weeks prior to diabetes onset. To validate the relevance to human diabetes, we assayed serum from children with new-onset type 1 diabetes compared with healthy children. While total serum miR-21-5p and total serum EVs were reduced in diabetic participants, serum EV miR-21-5p was increased threefold compared with non-diabetic individuals. By contrast, both serum and EV miR-375-5p were increased in parallel among diabetic participants.
Conclusions/interpretation: We propose that circulating EV miR-21-5p may be a promising marker of developing type 1 diabetes. Additionally, our findings highlight that, for certain miRNAs, total circulating miRNA levels are distinct from circulating EV miRNA content.
Keywords: Beta cell signal transduction; Cell lines; Human; Prediction and prevention of type 1 diabetes.
Conflict of interest statement
The authors declare that there is no duality of interest associated with this manuscript.
Figures
Similar articles
-
Beta cell extracellular vesicle PD-L1 as a novel regulator of CD8+ T cell activity and biomarker during the evolution of type 1 diabetes.Diabetologia. 2025 Feb;68(2):382-396. doi: 10.1007/s00125-024-06313-2. Epub 2024 Nov 7. Diabetologia. 2025. PMID: 39508879
-
Circulating Plasma Extracellular Vesicles from Septic Mice Induce Inflammation via MicroRNA- and TLR7-Dependent Mechanisms.J Immunol. 2018 Dec 1;201(11):3392-3400. doi: 10.4049/jimmunol.1801008. Epub 2018 Oct 24. J Immunol. 2018. PMID: 30355788 Free PMC article.
-
MicroRNA 21 targets BCL2 mRNA to increase apoptosis in rat and human beta cells.Diabetologia. 2017 Jun;60(6):1057-1065. doi: 10.1007/s00125-017-4237-z. Epub 2017 Mar 9. Diabetologia. 2017. PMID: 28280903 Free PMC article.
-
Regulation of the MIR155 host gene in physiological and pathological processes.Gene. 2013 Dec 10;532(1):1-12. doi: 10.1016/j.gene.2012.12.009. Epub 2012 Dec 14. Gene. 2013. PMID: 23246696 Review.
-
Circulating Extracellular Vesicles Carry Immune Regulatory miRNAs and Regulate Vaccine Efficacy and Local Inflammatory Response After Vaccination.Front Immunol. 2021 Jun 15;12:685344. doi: 10.3389/fimmu.2021.685344. eCollection 2021. Front Immunol. 2021. PMID: 34211472 Free PMC article. Review.
Cited by
-
Differential Expression and Bioinformatics Analysis of Plasma-Derived Exosomal circRNA in Type 1 Diabetes Mellitus.J Immunol Res. 2022 Oct 27;2022:3625052. doi: 10.1155/2022/3625052. eCollection 2022. J Immunol Res. 2022. PMID: 36339941 Free PMC article.
-
Nanotechnology in Immunotherapy for Type 1 Diabetes: Promising Innovations and Future Advances.Pharmaceutics. 2022 Mar 15;14(3):644. doi: 10.3390/pharmaceutics14030644. Pharmaceutics. 2022. PMID: 35336018 Free PMC article. Review.
-
Extracellular Vesicles in Type 1 Diabetes: A Versatile Tool.Bioengineering (Basel). 2022 Mar 4;9(3):105. doi: 10.3390/bioengineering9030105. Bioengineering (Basel). 2022. PMID: 35324794 Free PMC article. Review.
-
MicroRNA‑532‑5p regulates oxidative stress and insulin secretion damage in high glucose‑induced pancreatic β cells by downregulating the expression levels of CCND1.Mol Med Rep. 2021 Nov;24(5):793. doi: 10.3892/mmr.2021.12433. Epub 2021 Sep 13. Mol Med Rep. 2021. PMID: 34515323 Free PMC article.
-
The β Cell in Diabetes: Integrating Biomarkers With Functional Measures.Endocr Rev. 2021 Sep 28;42(5):528-583. doi: 10.1210/endrev/bnab021. Endocr Rev. 2021. PMID: 34180979 Free PMC article. Review.
References
-
- Eisenbarth GS. Type I diabetes mellitus. A chronic autoimmune disease. The New England journal of medicine. 1986;314:1360–1368. - PubMed
-
- Heninger A-K, Eugster A, Kuehn D, et al. A divergent population of autoantigen-responsive CD4+ T cells in infants prior to β cell autoimmunity. Science Translational Medicine. 2017:9. pii eaaf8848. - PubMed
Publication types
MeSH terms
Substances
Grants and funding
LinkOut - more resources
Full Text Sources
Other Literature Sources
Medical
Molecular Biology Databases
