

Prevalence of Obesity Among Youths by Household Income and Education Level of Head of Household - United States 2011-2014
- PMID: 29447142
- PMCID: PMC5815488
- DOI: 10.15585/mmwr.mm6706a3
Prevalence of Obesity Among Youths by Household Income and Education Level of Head of Household - United States 2011-2014
Abstract
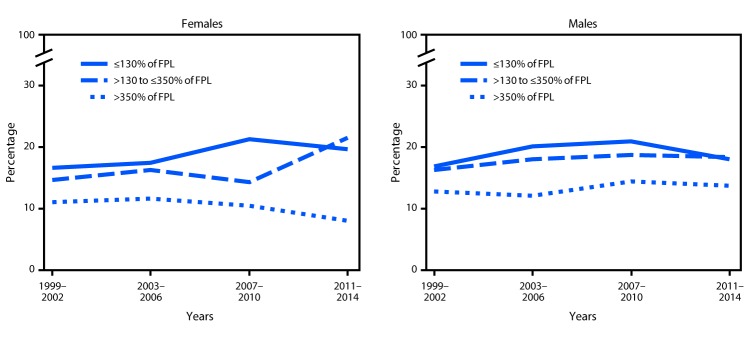
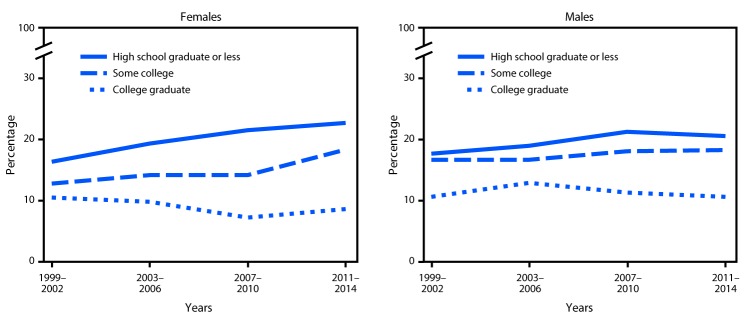
Obesity prevalence varies by income and education level, although patterns might differ among adults and youths (1-3). Previous analyses of national data showed that the prevalence of childhood obesity by income and education of household head varied across race/Hispanic origin groups (4). CDC analyzed 2011-2014 data from the National Health and Nutrition Examination Survey (NHANES) to obtain estimates of childhood obesity prevalence by household income (≤130%, >130% to ≤350%, and >350% of the federal poverty level [FPL]) and head of household education level (high school graduate or less, some college, and college graduate). During 2011-2014 the prevalence of obesity among U.S. youths (persons aged 2-19 years) was 17.0%, and was lower in the highest income group (10.9%) than in the other groups (19.9% and 18.9%) and also lower in the highest education group (9.6%) than in the other groups (18.3% and 21.6%). Continued progress is needed to reduce disparities, a goal of Healthy People 2020. The overall Healthy People 2020 target for childhood obesity prevalence is <14.5% (5).
Conflict of interest statement
No conflicts of interest were reported.
Figures
References
-
- Wang Y, Zhang Q. Are American children and adolescents of low socioeconomic status at increased risk of obesity? Changes in the association between overweight and family income between 1971 and 2002. Am J Clin Nutr 2006;84:707–16. - PubMed
-
- Ogden CL, Lamb MM, Carroll MD, Flegal KM. Obesity and socioeconomic status in children and adolescents: United States, 2005–2008. NCHS Data Brief 2010;51:1–8. - PubMed
-
- National Center for Health Statistics. Healthy People 2020 midcourse review. Chapter 29: nutrition and weight status. Hyattsville, MD: US Department of Health and Human Services, CDC, National Center for Health Statistics; 2016. https://www.cdc.gov/nchs/data/hpdata2020/HP2020MCR-C29-NWS.pdf
MeSH terms
LinkOut - more resources
Full Text Sources
Other Literature Sources
Medical
