

doi: 10.15585/mmwr.mm6706a1.
Update: Influenza Activity - United States, October 1, 2017-February 3, 2018
Affiliations
- PMID: 29447145
- PMCID: PMC5815487
- DOI: 10.15585/mmwr.mm6706a1
Item in Clipboard
Update: Influenza Activity - United States, October 1, 2017-February 3, 2018
MMWR Morb Mortal Wkly Rep.
.
Abstract
Influenza activity in the United States began to increase in early November 2017 and rose sharply from December through February 3, 2018; elevated influenza activity is expected to continue for several more weeks. Influenza A viruses have been most commonly identified, with influenza A(H3N2) viruses predominating, but influenza A(H1N1)pdm09 and influenza B viruses were also reported. This report summarizes U.S. influenza activity* during October 1, 2017-February 3, 2018,† and updates the previous summary (1).
Conflict of interest statement
No conflicts of interest were reported.
Figures
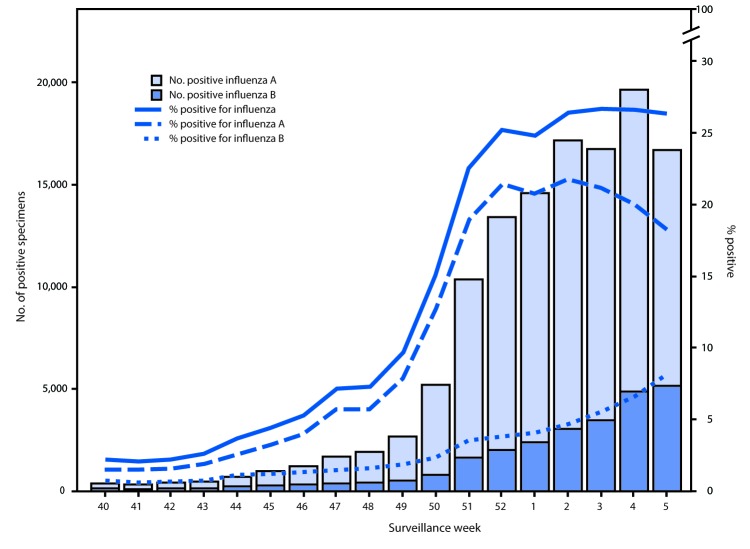
Number and percentage of respiratory specimens testing positive for influenza reported by clinical laboratories, by influenza virus type and surveillance week — United States, October 1, 2017–February 3, 2018 * A total of 124,316 (18.7%) of 666,493 specimens tested were positive during October 1, 2017–February 3, 2018. † As of February 9, 2018.
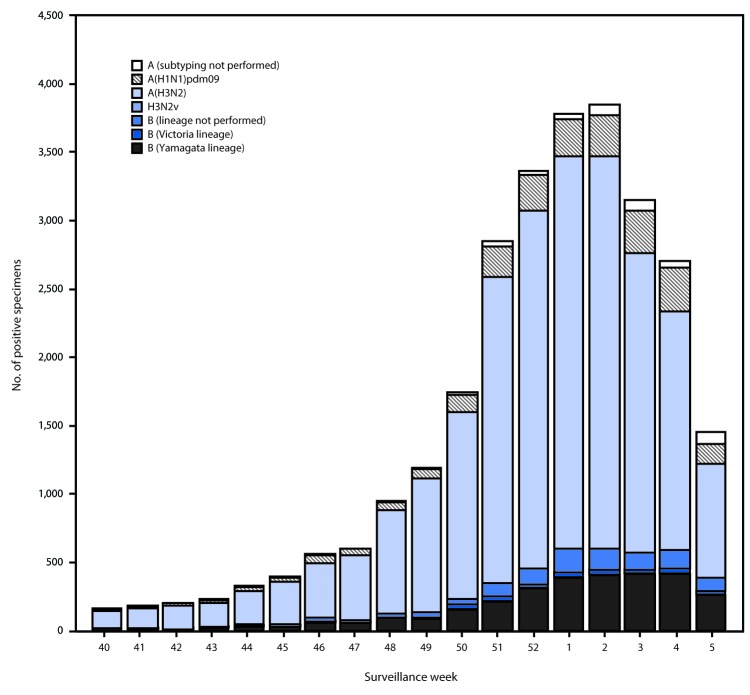
Number of respiratory specimens testing positive for influenza reported by public health laboratories, by influenza virus type, subtype/lineage, and surveillance week — United States, October 1, 2017–February 3, 2018 * N = 27,669. † As of February 9, 2018.
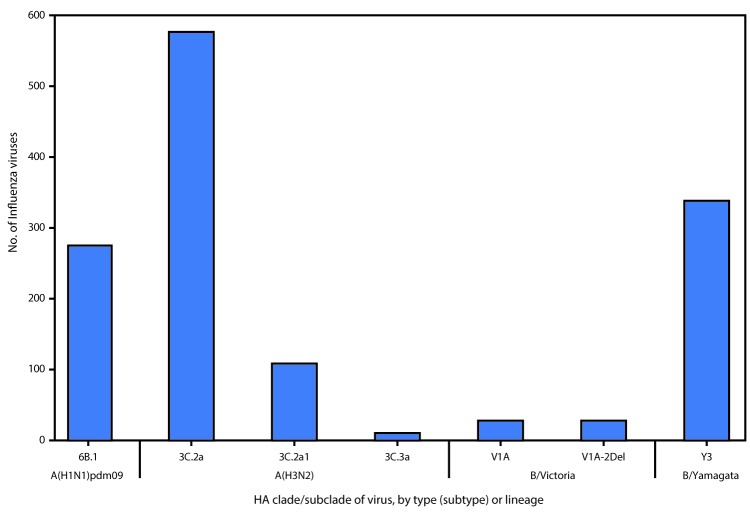
Genetic characterization of U.S. viruses collected during October 1, 2017–February 3, 2018 Abbreviation: HA = hemagglutinin. * As of February 9, 2018.
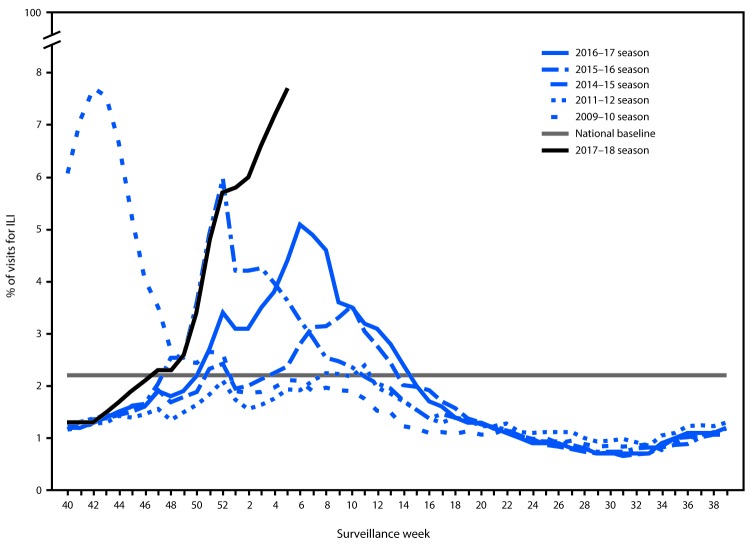
Percentage of outpatient visits for influenza-like illness (ILI) reported to CDC, by surveillance week — U.S. Outpatient Influenza-Like Illness Surveillance Network (ILINet), 2017–18 influenza season and selected previous influenza seasons * Defined as fever (temperature of ≥100°F [≥37.8°C], oral or equivalent) and cough or sore throat, without a known cause other than influenza. As of February 9, 2018.
References
MeSH terms
Substances
LinkOut - more resources
Full Text Sources
Other Literature Sources
Medical
