Review
. 2018 Feb 15;14(2):e1006770.
doi: 10.1371/journal.ppat.1006770. eCollection 2018 Feb.

Influenza interaction with cocirculating pathogens and its impact on surveillance, pathogenesis, and epidemic profile: A key role for mathematical modelling

Affiliations
Review

Influenza interaction with cocirculating pathogens and its impact on surveillance, pathogenesis, and epidemic profile: A key role for mathematical modelling

Lulla Opatowski et al. PLoS Pathog. .

Abstract

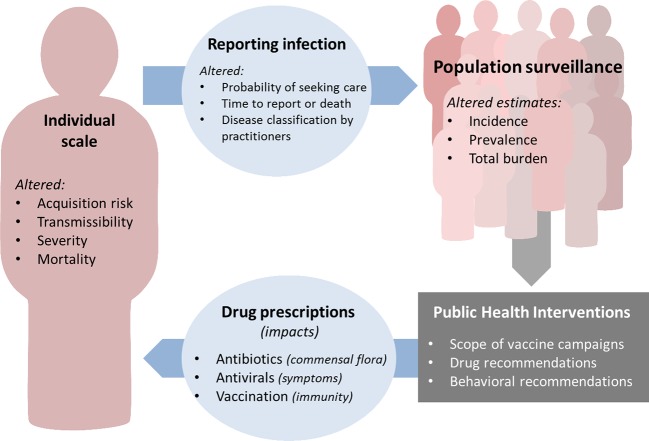
Evidence is mounting that influenza virus interacts with other pathogens colonising or infecting the human respiratory tract. Taking into account interactions with other pathogens may be critical to determining the real influenza burden and the full impact of public health policies targeting influenza. This is particularly true for mathematical modelling studies, which have become critical in public health decision-making. Yet models usually focus on influenza virus acquisition and infection alone, thereby making broad oversimplifications of pathogen ecology. Herein, we report evidence of influenza virus interactions with bacteria and viruses and systematically review the modelling studies that have incorporated interactions. Despite the many studies examining possible associations between influenza and Streptococcus pneumoniae, Staphylococcus aureus, Haemophilus influenzae, Neisseria meningitidis, respiratory syncytial virus (RSV), human rhinoviruses, human parainfluenza viruses, etc., very few mathematical models have integrated other pathogens alongside influenza. The notable exception is the pneumococcus-influenza interaction, for which several recent modelling studies demonstrate the power of dynamic modelling as an approach to test biological hypotheses on interaction mechanisms and estimate the strength of those interactions. We explore how different interference mechanisms may lead to unexpected incidence trends and possible misinterpretation, and we illustrate the impact of interactions on public health surveillance using simple transmission models. We demonstrate that the development of multipathogen models is essential to assessing the true public health burden of influenza and that it is needed to help improve planning and evaluation of control measures. Finally, we identify the public health, surveillance, modelling, and biological challenges and propose avenues of research for the coming years.


Conflict of interest statement

The authors have declared that no competing interests exist.

Figures

Fig 1
Fig 1. Influenza interactions with other pathogens occur within host or at the population level.
Each interaction could either inhibit or enhance coinfection, depending on the combination of pathogens. (A) Cellular-level interactions: (1) direct interactions between viral products; (2) altered receptor presentation; (3) cell damage, e.g., its surface receptors; (4) modification of release of immune system mediators; (5) competition for host resources among influenza and other pathogens. (B) Host-level interactions: (1) change of transmissibility due to symptoms; (2) individual variation in commensal microbiota; (3) effect of symptomatic responses to infection; (4) tissue damage, e.g., in the nasopharynx or lung; (5) competition for host resources, e.g., target cells for infection; (6) immune cell–mediated interaction; (7) immune signalling–mediated interaction; (8) antibody-mediated interaction. (C) Population-level interaction: (1) behavioural responses to disease; (2) medication use; (3) vaccination behaviour. Bacterial interaction mechanisms include A1–5, B1–4 and 7, C1–3. Viral interaction mechanisms include A1–2 and 4–5, B1–3 and 4–8, C1–3.
Fig 2
Fig 2. Cycle of factors affected by nonneutral interactions at the individual level and their impact on influenza surveillance, treatment, prevention, and control.
Factors that affect coinfection on an individual scale can feed forward to an effect on population surveillance through their effects on the reporting of infection. Decisions on public health interventions are made in response to population-level data. These interventions then take effect at the individual level, to give a feedback loop both generated and impacted by effects of coinfection.
Fig 3
Fig 3. Illustration of a simple model of two circulating pathogens in interactions.
Schematic of the compartments and rates of transition between compartments, with equations of the forces of infection by pathogen 1 (λ1), pathogen 2 (λ2) for susceptible hosts, and pathogen 1 (λ21) and pathogen 2 (λ12) for hosts already infected by the other pathogen. The full system of ordinary differential equations describing the changes of the compartment’s populations over time is described in S1 Appendix, section B. Details of the model and parameters are provided in Box 3.
Fig 4
Fig 4. Example model outputs showing effect of synergistic and competitive interaction.
Box 3 gives details on the model that produces these epidemic trajectories. (A) In the baseline enhancing scenario, an endemic bacterial pathogen (blue) occurs at 5% prevalence. An influenza epidemic occurs with no interaction, and the bacterial prevalence does not change. If the presence of influenza coinfection increases bacterial transmissibility by 4-fold (σ1 = 4), then there is a transient rise in bacterial prevalence. If there is also an increase in influenza transmissibility during coinfection (σ1 = 4 and σ2 = 2), then there is also a higher and earlier influenza peak as a result of coinfection. (B) In the baseline competition scenario, the second epidemic pathogen is introduced later than influenza. The two pathogens have the same transmission characteristics (same γ, same β). If there is only a 50% chance of infection with pathogen 2 when individuals are infected with pathogen 1 (δ1 = 0.5), then the epidemic trajectory of pathogen 2 is lower and later. If competition is even stronger (δ1 = 0.1) so there is a 90% reduction in chance of coinfection, the profile of pathogen 2 is even further separated from pathogen 1. Computer code generating these trajectories is given in S1 Code.

References

    1. Webster RG, Monto A. S., Braciale T. J. & Lamb R. A. (2013) Textbook of Influenza.
    1. de Steenhuijsen Piters WAA, Sanders EAM, Bogaert D, Grice E, Segre J, et al. (2015) The role of the local microbial ecosystem in respiratory health and disease. Philosophical transactions of the Royal Society of London Series B, Biological sciences 370: 244–253. - PMC - PubMed
    1. Bosch AATM, Biesbroek G, Trzcinski K, Sanders EAM, Bogaert D (2013) Viral and bacterial interactions in the upper respiratory tract. PLoS Pathog 9: e1003057 doi: 10.1371/journal.ppat.1003057 - DOI - PMC - PubMed
    1. Yamin D, Balicer RD, Galvani AP (2014) Cost-effectiveness of influenza vaccination in prior pneumonia patients in Israel. Vaccine 32: 4198–4205. doi: 10.1016/j.vaccine.2014.05.015 - DOI - PMC - PubMed
    1. Bedford T, Riley S, Barr IG, Broor S, Chadha M, et al. (2015) Global circulation patterns of seasonal influenza viruses vary with antigenic drift. Nature 523: 217–220. doi: 10.1038/nature14460 - DOI - PMC - PubMed

Publication types

MeSH terms