. 2018 Apr 20;46(7):3446-3457.
doi: 10.1093/nar/gky088.

Super-resolution imaging identifies PARP1 and the Ku complex acting as DNA double-strand break sensors

Affiliations

Super-resolution imaging identifies PARP1 and the Ku complex acting as DNA double-strand break sensors

Guang Yang et al. Nucleic Acids Res. .

Abstract

DNA double-strand breaks (DSBs) are fatal DNA lesions and activate a rapid DNA damage response. However, the earliest stage of DSB sensing remains elusive. Here, we report that PARP1 and the Ku70/80 complex localize to DNA lesions considerably earlier than other DSB sensors. Using super-resolved fluorescent particle tracking, we further examine the relocation kinetics of PARP1 and the Ku70/80 complex to a single DSB, and find that PARP1 and the Ku70/80 complex are recruited to the DSB almost at the same time. Notably, only the Ku70/80 complex occupies the DSB exclusively in the G1 phase; whereas PARP1 competes with the Ku70/80 complex at the DSB in the S/G2 phase. Moreover, in the S/G2 phase, PARP1 removes the Ku70/80 complex through its enzymatic activity, which is further confirmed by in vitro DSB-binding assays. Taken together, our results reveal PARP1 and the Ku70/80 complex as critical DSB sensors, and suggest that PARP1 may function as an important regulator of the Ku70/80 complex at the DSBs in the S/G2 phase.


Figures

Figure 1.
Figure 1.
Recruitment kinetics of potential DNA damage sensors. (A) The relocation kinetics of PARP1, Ku70, Ku80, NBS1, RPA2, and SIRT6 to the DNA damage sites. GFP-tagged proteins were expressed in U2OS cells, and the relocation kinetics was monitored at different time points following laser microirradiation. (B) The relocation kinetics of PARP1 to the DNA damage sites. GFP-PARP1 was expressed in wild-type (Ku70+/+) or Ku70−/− MEFs. (C) The relocation kinetics of Ku70 to the DNA damage sites. The GFP-Ku70 was expressed in wild-type (Parp1+/+) or Parp1−/− MEFs. The GFP signal intensity at the microirradiation area was measured with ImageJ and represented in the right.
Figure 2.
Figure 2.
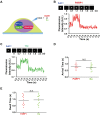
Single molecule imaging reveals the recruitment kinetics of PARP1 and the Ku complex in live cells. (A) The experimental system for investigating the recruitment of a single PARP1 or Ku complex molecule to the DSB in live cells. (B) The recruitment kinetics of PARP1 at the DSB. Plots represent PARP1 fluorescence intensity recorded at the DNA damage site. BFP-LacI indicates the DSB site. Insets show fluorescence images taken at the indicated time points. (C) The recruitment kinetics of a single Ku complex to the DSB. (D) Distribution of the arrival time of PARP1 (n = 12) or the Ku complex (n = 12) at the DSB. (E) Distribution of the dwell time of PARP1 or the Ku complex at the DSB. Mann-Whitney U test was performed to analyze the group difference. A. U., arbitrary unit; N. S., nonsignificant (P > 0.05).
Figure 3.
Figure 3.
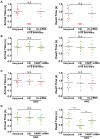
PARP1 and the Ku complex compete with each other to occupy the DSB. (A) PARP1 and the Ku complex compete with each other to relocate to the DSB. Single PARP1 or Ku complex was examined at the DSB. Mann–Whitney U test was performed for analyzing the difference in the arrival time or dwell time between PARP1 and the Ku complex at the DSB. N.S.: nonsignificant (P > 0.05). (B) The ratio of PARP1 and the Ku complex at the DSB. Ku→PARP1 represents an event in which the Ku complex is the first to reach the DSB and subsequently gets replaced by PARP1. Cells were synchronized and released at the G1/S boundary or S/G2 phase by double thymidine block.(C) The representative event shows that PARP1 can remove the Ku complex at the DSB in S/G2 cell. (D) Analysis of the difference in the arrival time and the dwell time of PARP1 or the Ku complex between unsynchronized cells and cells at the G1/S boundary. (E) Analyzing the difference in the arrival time (P > 0.05) and the dwell time (P < 0.01) of Ku complex between unsynchronized cells and S/G2 cells. (F) Analysis of the difference of the arrival time and the dwell time of PARP1 between unsynchronized cells and S/G2 cells. Statistical significance in D–F was tested using Mann–Whitney U test, N.S.: nonsignificant (P > 0.05).
Figure 4.
Figure 4.
Lacking endogenous PARP1 or the Ku complex regulates each other for the DSB relocation. (A) Lacking the Ku complex does not promote PARP1 occupancy at the DSB in the G1/S phase. The arrival and the dwell time of PARP1in the cells at the G1/S boundary were compared to those in the unsynchronized cells. (B) Lacking PARP1 does not affect the relocation of the Ku complex in the G1 cells. (C) The PARP1 relocation in the S/G2 cells is unaffected in the absence of the Ku complex. (D) Lacking PARP1 prolongs the retention of the Ku complex at the DSB in the S/G2 cells. The arrival time and the dwell time of the Ku complex in the S/G2 phase were compared to those in the unsynchronized cells. *, P < 0.05; ** P < 0.01; N.S.: nonsignificant (P > 0.05).
Figure 5.
Figure 5.
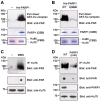
PARP1 PARylates the Ku complex. (A) PARP1 PARylates the Ku complex in vitro. The recombinant proteins were examined by SDS-PAGE and Western blotting with indicated antibodies. The loaded proteins were also examined by Coomassie blue staining. (B) The enzymatic activity of PARP1 is required for the PARylation of the Ku complex. The E998A mutant was examined in the in vitro PARylation of the Ku complex. (C) The Ku70 is PARylated in response to DNA damage. U2OS cells were treated with 5 μM MMS for 30 min. The Ku complex was examined by indicated antibodies. The level of PARylation in the whole cell lysates was examined by the anti-PAR antibody. (D) PARP1 is required for the PARylation of the Ku complex. Both U2OS cells and PARP-null cells were treated with MMS. The PARylation level of the Ku complex was examined.
Figure 6.
Figure 6.
PARP1 replaces the Ku complex in the presence of NAD+. (A) A schematic model describing the in vitro competition assay between PARP1 and the Ku complex to occupy the DSBs. The histogram shows the ratio of the DSBs occupied by PARP1, the Ku complex or Ku complex replaced by PARP1 (Ku→PARP1). (B) In the absence of NAD+, PARP1 and the Ku complex occupy the DSBs for a prolonged time. Representative plots display PARP1 or the Ku complex at the DSBs. Dwell time of PARP1 and the Ku complex were measured. (C) In the presence of NAD+, PARP1 is able to remove the Ku complex from the DSBs. Three representative plots are shown. (D) The E988A mutant of PARP1 cannot remove the Ku complex. Representative plots were included. (E) A schematic model depicting PARP1-dependent removal of the Ku complex.
Figure 7.
Figure 7.
PARP1 plays an important role in DSB repair. (A) PARP1 is involved in DSB end processing. The NIH-3T3 cells at G1/S boundary or in the S/G2 phase were treated with or without 1 μM olaparib (Ola) followed by 2 Gy of IR. The foci of phosphor-Rpa2 (p-Rpa) were examined at the G1/S boundary (left panel) or in the S/G2 phase (middle panel). The relative fold change of foci formation was summarized in the right panel (**P < 0.01). (B) PARP1 is involved in alt-NHEJ in S/G2 phase. Three independent experiments were performed. Data were presented as mean ± SD (*P < 0.05). GFP reporter assays were used to examine c-NHEJ, alt-NHEJ and HR. The GFP positive cells were measured. (C) PARP1 plays an important role in maintaining cell viability in response to IR. The NIH-3T3 cells at G1/S boundary or in the S/G2 phase were treated with or without 1 μM olaparib followed by 5 Gy of IR. The MTT assays were performed to measure the cell viability. Three independent experiments were performed. Data were presented as mean ± SD (*P < 0.05).

References

    1. Jackson S.P., Bartek J.. The DNA-damage response in human biology and disease. Nature. 2009; 461:1071–1078. - PMC - PubMed
    1. Ciccia A., Elledge S.J.. The DNA damage response: making it safe to play with knives. Mol. Cell. 2010; 40:179–204. - PMC - PubMed
    1. Blackford A.N., Jackson S.P.. ATM, ATR, and DNA-PK: The Trinity at the Heart of the DNA Damage Response. Mol. Cell. 2017; 66:801–817. - PubMed
    1. Stracker T.H., Petrini J.H.. The MRE11 complex: starting from the ends. Nat. Rev. Mol. Cell Biol. 2011; 12:90–103. - PMC - PubMed
    1. Lee J.H., Paull T.T.. ATM activation by DNA double-strand breaks through the Mre11-Rad50-Nbs1 complex. Science. 2005; 308:551–554. - PubMed

Publication types