. 2018 May 15:172:903-912.
doi: 10.1016/j.neuroimage.2018.01.035. Epub 2018 Feb 12.

Robust detrending, rereferencing, outlier detection, and inpainting for multichannel data

Affiliations

Robust detrending, rereferencing, outlier detection, and inpainting for multichannel data

Alain de Cheveigné et al. Neuroimage. .

Abstract

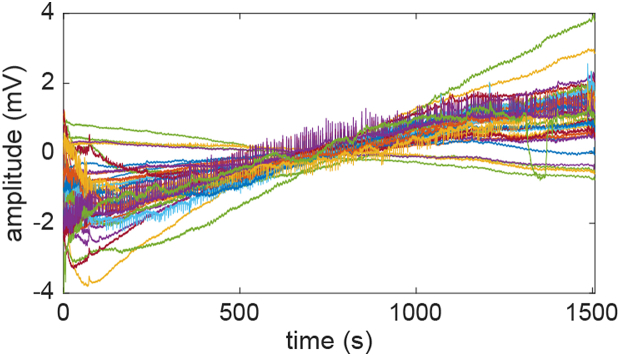
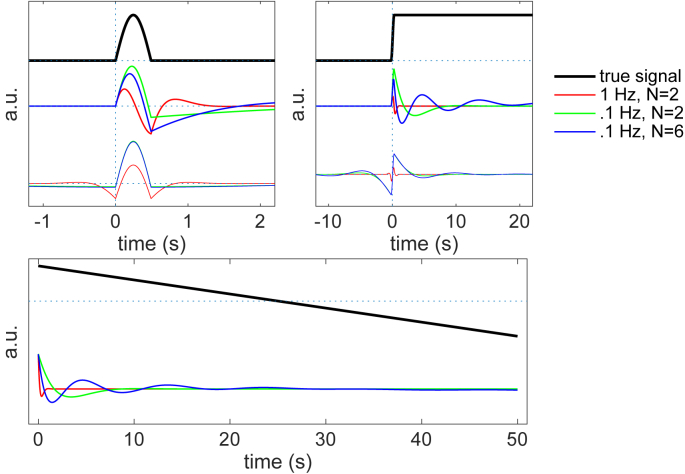
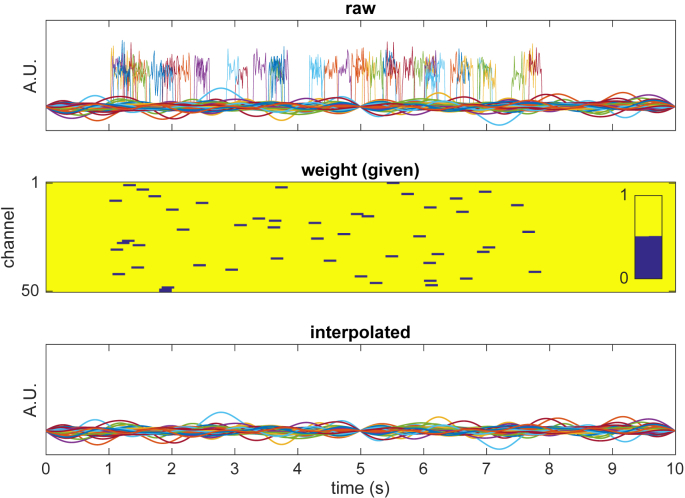
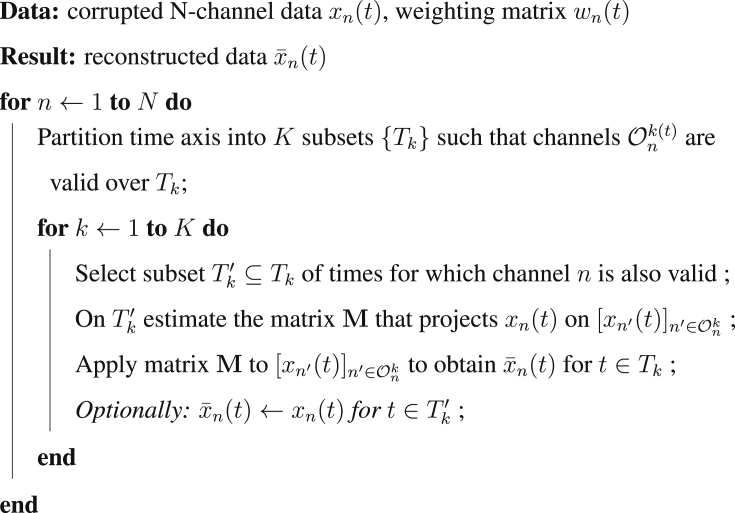
Electroencephalography (EEG), magnetoencephalography (MEG) and related techniques are prone to glitches, slow drift, steps, etc., that contaminate the data and interfere with the analysis and interpretation. These artifacts are usually addressed in a preprocessing phase that attempts to remove them or minimize their impact. This paper offers a set of useful techniques for this purpose: robust detrending, robust rereferencing, outlier detection, data interpolation (inpainting), step removal, and filter ringing artifact removal. These techniques provide a less wasteful alternative to discarding corrupted trials or channels, and they are relatively immune to artifacts that disrupt alternative approaches such as filtering. Robust detrending allows slow drifts and common mode signals to be factored out while avoiding the deleterious effects of glitches. Robust rereferencing reduces the impact of artifacts on the reference. Inpainting allows corrupt data to be interpolated from intact parts based on the correlation structure estimated over the intact parts. Outlier detection allows the corrupt parts to be identified. Step removal fixes the high-amplitude flux jump artifacts that are common with some MEG systems. Ringing removal allows the ringing response of the antialiasing filter to glitches (steps, pulses) to be suppressed. The performance of the methods is illustrated and evaluated using synthetic data and data from real EEG and MEG systems. These methods, which are mainly automatic and require little tuning, can greatly improve the quality of the data.

Keywords: Artifact; CCA; CSP; DSS; Detrending; ECoG; EEG; ICA; LFP; MEG; Robust statistics; SNS; Sensor noise; Weighted regression.


Figures

Fig. 1
Fig. 1
Sample of 40-channel EEG data with slow drifts. Data were acquired with a BioSemi system at a rate of 2048 Hz in the calibration phase of an experiment investigating auditory perception and brain state. The mean of each channel was subtracted before plotting.
Fig. 2
Fig. 2
Top: pulse (left, black) and step (right black) signals and corresponding filter outputs for 3 different high-pass filters. Lowermost curves are for non-causal filters (Matlab filtfilt function). Bottom: descending ramp (black) and filter output for 3 different Butterworth high-pass filters with cutoff frequency and order (N) indicated in the legend.
Fig. 3
Fig. 3
Top left: sample of EEG signal (black) and order-10 polynomial fit (red). Right: detrended data. Middle left: same EEG data as top with an artificial glitch (black) and polynomial fit (red). Right: “detrended” data. Bottom: same data with robust polynomial fit (red). The fit was weighted using the weighting function (mask) symbolized in grey. Right: detrended data. Data are from the same dataset as Fig. 1.
Fig. 4
Fig. 4
Robust detrending of EEG data. Data consist of 200 repetitions of a synthetic unipolar pulse of duration 500 ms and amplitude 20 μV superimposed on a real EEG signal (top). Middle left: trial average (black), linear fit (dotted red) and robust linear fit (full red) to trial average. Middle right: trial average of high-passed data (0.3 Hz cutoff, order 2). Bottom left: detrended trial average. Bottom right: robust detrended trial average. Data are from the same dataset as Fig. 1.
Fig. 5
Fig. 5
Top left: raw EEG signal (black) and 30th order polynomial fit (red). Top right: detrended signal. Data are from the same dataset as Fig. 1. Bottom: Robust removal of a 50 Hz sinusoidal trend. Left: 1 Hz sinusoidal “signal” corrupted by 50 Hz artifact and a temporally-localized glitch (amplitude 100). Center: a 50 Hz sinusoidal function is fit to the data and subtracted. Right: same, but the fit is weighted by a weighting matrix that is zero at time of the glitch.
Fig. 6
Fig. 6
EEG signal inpainting. Top: 50-channel synthetic signal (rank 10) corrupted with randomly-placed “glitches” (thin lines). Middle: weighting matrix, zero at the positions of the glitches. Bottom: signal interpolated by the inpainting algorithm.
Fig. 7
Fig. 7
Outlier detection. Top: weight mask estimated from the signal plotted in Fig. 6 (top). bottom: signal interpolated using the estimated weighting mask.
Fig. 8
Fig. 8
Outlier detection. Top: weight mask estimated from a segment of 128-channel EEG (detrended). Middle: one channel of EEG, showing the raw, detrended, and interpolated signal, offset vertically for clarity. Bottom: same for another channel. Data are from the same dataset as Fig. 1.
Fig. 9
Fig. 9
Robust rereferencing. Single EEG channel before (blue) and after standard rereferencing (black) and robust rereferencing (red).
Fig. 10
Fig. 10
Step and ringing artifact removal. Left: one channel of MEG data in response to simulated deep brain stimulation (Oswal et al., 2016) (black) and the same signal after automatic step removal (red). Right: one channel of MEG from same data set showing a stimulus artifact (black) and the same signal after ringing removal (red). Data were recorded on a 275-channel CTF system at a 2400 Hz sampling rate (Oswal et al., 2016).
Image 1
Image 2
Image 3

Similar articles

Cited by

References

    1. Acunzo D.J., MacKenzie G., van Rossum M.C.W. Systematic biases in early ERP and ERF components as a result of high-pass filtering. J. Neurosci. Meth. 2012;209:212–218. - PubMed
    1. Adler A., Emiya V., Jafari M.G., Elad M., Gribonval R., Plumbley M.D. Audio inpainting. IEEE Trans. Audio Speech Lang. Process. 2012;20:922–932.
    1. Aggarwal C.C. Springer; 2016. Outlier Analysis.
    1. Bertalmio M., Sapiro G., Caselles V., Ballester C. Proc. SIGGRAPHÕ00, p. 417–424. 2000. Image inpainting.
    1. Bigdely-Shamlo N., Mullen T., Kothe C., Su K.M., Robbins K.A. The PREP pipeline: standardized preprocessing for large-scale EEG analysis. Front. Neuroinf. 2015;9:16. - PMC - PubMed

Publication types