. 2018 Feb 15;18(1):35.
doi: 10.1186/s12870-018-1250-4.

Comparative analysis of alfalfa (Medicago sativa L.) leaf transcriptomes reveals genotype-specific salt tolerance mechanisms

Affiliations

Comparative analysis of alfalfa (Medicago sativa L.) leaf transcriptomes reveals genotype-specific salt tolerance mechanisms

Yunting Lei et al. BMC Plant Biol. .

Abstract

Background: Soil salinity is an important factor affecting growth, development, and productivity of almost all land plants, including the forage crop alfalfa (Medicago sativa). However, little is known about how alfalfa responds and adapts to salt stress, particularly among different salt-tolerant cultivars.

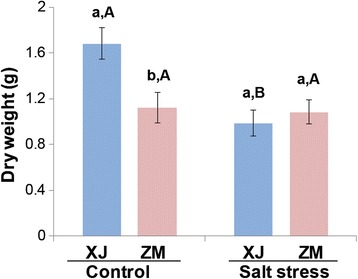
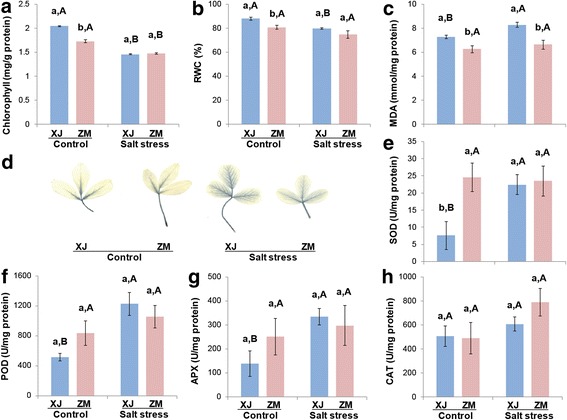
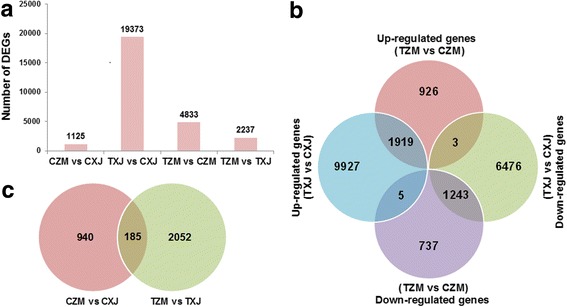
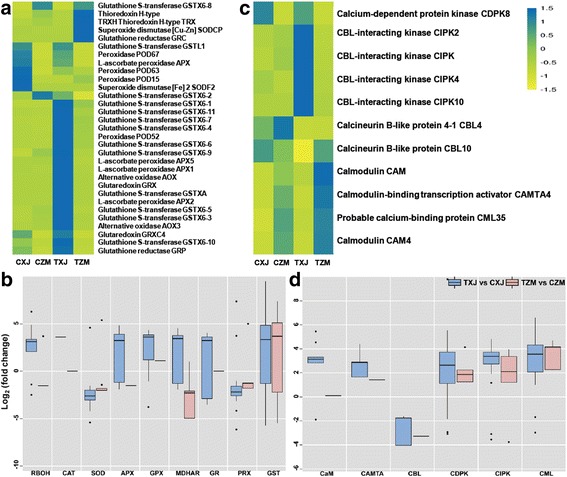
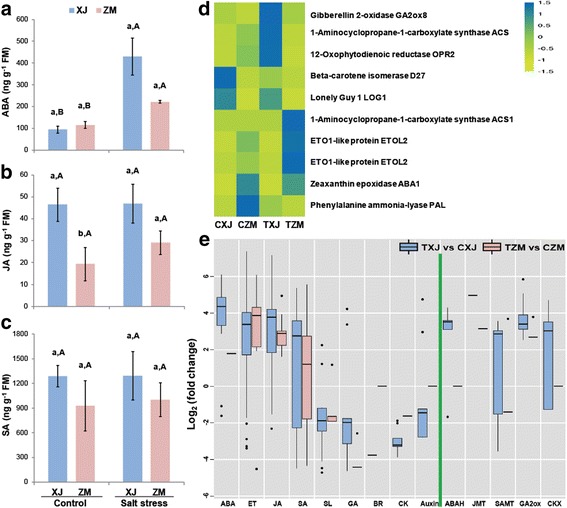
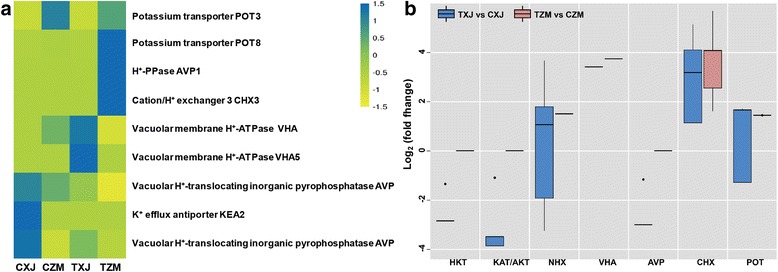
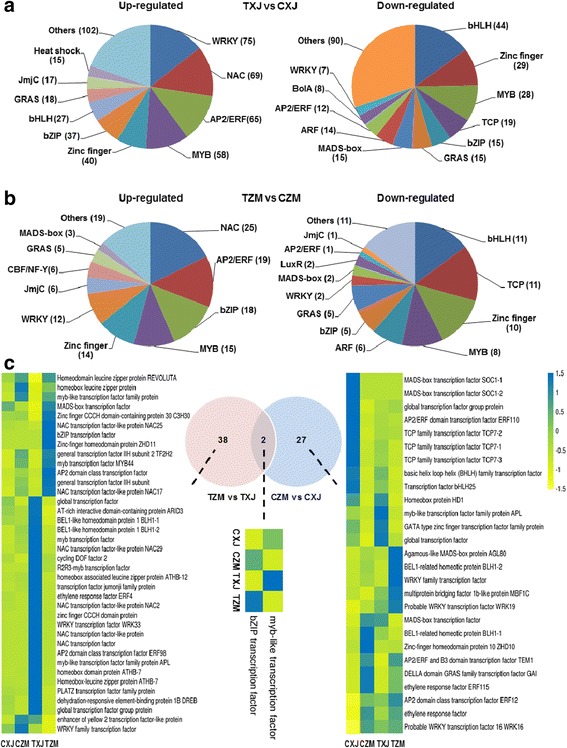
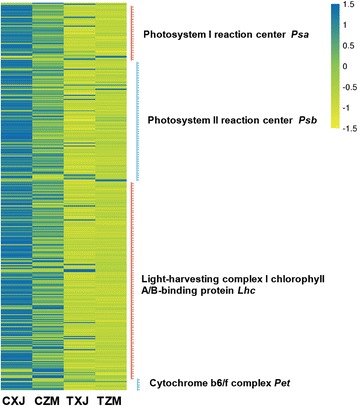
Results: Among seven alfalfa cultivars, we found that Zhongmu-1 (ZM) is relatively salt-tolerant and Xingjiang Daye (XJ) is salt-sensitive. Compared to XJ, ZM showed slower growth under low-salt conditions, but exhibited stronger tolerance to salt stress. RNA-seq analysis revealed 2237 and 1125 differentially expressed genes (DEGs) between ZM and XJ in the presence and absence of salt stress, among which many genes are involved in stress-related pathways. After salt treatment, compared with the controls, the number of DEGs in XJ (19373) was about four times of that in ZM (4833). We also detected specific differential gene expression patterns: In response to salt stress, compared with XJ, ZM maintained relatively more stable expression levels of genes related to the ROS and Ca2+ pathways, phytohormone biosynthesis, and Na+/K+ transport. Notably, several salt resistance-associated genes always showed greater levels of expression in ZM than in XJ, including a transcription factor. Consistent with the suppression of plant growth resulting from salt stress, the expression of numerous photosynthesis- and growth hormone-related genes decreased more dramatically in XJ than in ZM. By contrast, the expression levels of photosynthetic genes were lower in ZM under low-salt conditions.

Conclusions: Compared with XJ, ZM is a salt-tolerant alfalfa cultivar possessing specific regulatory mechanisms conferring exceptional salt tolerance, likely by maintaining high transcript levels of abiotic and biotic stress resistance-related genes. Our results suggest that maintaining this specific physiological status and/or plant adaptation to salt stress most likely arises by inhibition of plant growth in ZM through plant hormone interactions. This study identifies new candidate genes that may regulate alfalfa tolerance to salt stress and increases the understanding of the genetic basis for salt tolerance.

Keywords: Abscisic acid; Alfalfa; Constitutive expression; Medicago sativa; Salt stress.


Conflict of interest statement

Ethics approval and consent to participate

Not applicable

Consent for publication

Not applicable

Competing interests

The authors declare that they have no competing interests.

Publisher’s Note

Springer Nature remains neutral with regard to jurisdictional claims in published maps and institutional affiliations.

Figures

Fig. 1
Fig. 1
Biomass differences between XJ and ZM in response to salt stress. Alfalfa XJ and ZM plants (30 days old) were treated with 0.5 M NaCl (salt stress) or kept in normal soil (control). After 20 days, the shoot of every plant was harvested, and the aboveground biomass was measured (n = 50). All data are shown as mean ± standard error. Different lowercase letters represent significant differences between cultivars; different uppercase letters indicate significant differences between treatments (Tukey HSD test; P < 0.05)
Fig. 2
Fig. 2
Salt-induced physiological changes in the leaves of XJ and ZM. XJ and ZM plants, about 30 days old, were treated with 0.5 M NaCl (salt stress) or kept in low-salt soil (control). After 1 week, leaf chlorophyll content (a), RWC (b), and MDA content (c) were determined, superoxide levels were visually detected by NBT staining (d), and the activity of antioxidant enzymes SOD (e), POD (f), APX (g), and CAT (h) were also measured. For chlorophyll, RWC, MDA, and superoxide level analysis, three replicates were used, and the activity of SOD, POD, APX, and CAT was determined from five replicates. All data are shown as mean ± standard error. Different lowercase letters represent significant differences between cultivars; different uppercase letters indicate significant differences between treatments (Tukey HSD test; P < 0.05)
Fig. 3
Fig. 3
DEGs in XJ and ZM in the presence and absence of salt stress. XJ and ZM were treated with salt solution (treatment group; TXJ and TZM, respectively) or water (control group; CZM and CXJ, respectively), and subsequently samples were collected on the seventh day. a Summary of the number of DEGs in the presence and absence of salt stress. b Venn diagram indicating the DEGs from comparisons between CZM and CXJ and between TZM and TXJ. c Euler diagram of salt-responsive genes, including up- and down-regulated genes, in XJ and ZM
Fig. 4
Fig. 4
Expression of genes involved in second messenger signaling (ROS and Ca2+) in XJ and ZM. XJ and ZM were treated with salt solution (TXJ and TZM, respectively) or water (CZM and CXJ, respectively), and subsequently samples were collected on the seventh day. a Heatmap of the relative expression of the genes important for ROS catabolism. b Box plot indicating the expression changes of the genes involved in ROS homeostasis, in XJ and ZM, in response to salt treatment. c Heatmap of the relative expression of the genes important for Ca2+ downstream signaling. d Box plot indicating the expression changes of the salt-responsive genes involved in Ca2+ downstream signaling in XJ and ZM. Further detailed information is given in Additional file 2: Tables S4 and S5
Fig. 5
Fig. 5
ABA, JA, and SA levels and expression of phytohormone biosynthetic genes in XJ and ZM. XJ and ZM were treated with salt solution (TXJ and TZM, respectively) or water (CZM and CXJ, respectively), and subsequently samples were collected on the seventh day. ABA (a), JA (b), and SA (c) levels in ZM and XJ cultivars (n = 5). All data are shown as mean ± standard error. Different lowercase letters represent significant differences between cultivars; different uppercase letters indicate significant differences between treatments (Tukey’s HSD test; P < 0.05). d Heatmap of the relative expression of the genes encoding phytohormone biosynthesis enzymes. e Box plot indicating the expression changes of the salt-responsive genes involved in phytohormone biosynthesis in XJ and ZM. Further detailed information is given in Additional file 2: Table S6
Fig. 6
Fig. 6
Expression of the genes involved in ion transport in XJ and ZM. XJ and ZM were treated with salt solution (TXJ and TZM, respectively) or water (CZM and CXJ, respectively), and subsequently samples were collected on the seventh day. a Heatmap of the relative expression levels of genes encoding ion transporters. b Box plot indicating the expression changes of the salt-responsive genes of ion transporters in XJ and ZM. Further detailed information is given in Additional file 2: Table S7
Fig. 7
Fig. 7
Expression of the genes encoding transcription factors in XJ and ZM. XJ and ZM were treated with salt solution (TXJ and TZM, respectively) or water (control group; CZM and CXJ, respectively), and subsequently samples were collected on the seventh day. In response to salt treatment, the up- and down-regulated transcription factor gene families (gene numbers are shown in the brackets) in XJ (a) and ZM (b) were identified with RNA-seq analysis. c Venn diagram showing the numbers of DEGs encoding transcription factors between ZM and XJ under control and salt treatment conditions. Heatmaps indicate the relative gene expression levels of the DEGs. Further detailed information is given in Additional file 2: Table S8
Fig. 8
Fig. 8
Comparison of photosynthesis-related genes in XJ and ZM under low-salt and salt-stress conditions. XJ and ZM were treated with salt solution (TXJ and TZM, respectively) or water (control group; CZM and CXJ, respectively), and subsequently samples were collected on the seventh day. Heatmap indicates the relative transcript levels of the genes from four genes families, Lhcs, Pets, Psas and Psbs, which are important for photosynthesis. Further detailed information is given in Additional file 2: Table S9

References

    1. Roy SJ, Negrao S, Tester M. Salt resistant crop plants. Curr Opin Biotechnol. 2014;26:115–124. doi: 10.1016/j.copbio.2013.12.004. - DOI - PubMed
    1. Deinlein U, Stephan AB, Horie T, Luo W, Xu G, Schroeder JI. Plant salt-tolerance mechanisms. Trends Plant Sci. 2014;19(6):371–379. doi: 10.1016/j.tplants.2014.02.001. - DOI - PMC - PubMed
    1. Zhu JK. Salt and drought stress signal transduction in plants. Annu Rev Plant Biol. 2002;53:247–273. doi: 10.1146/annurev.arplant.53.091401.143329. - DOI - PMC - PubMed
    1. Steinhorst L, Kudla J. Calcium and reactive oxygen species rule the waves of signaling. Plant Physiol. 2013;163(2):471–485. doi: 10.1104/pp.113.222950. - DOI - PMC - PubMed
    1. Kurusu T, Kuchitsu K, Tada Y. Plant signaling networks involving Ca2+and Rboh/Nox-mediated ROS production under salinity stress. Front Plant Sci. 2015;6:427. doi: 10.3389/fpls.2015.00427. - DOI - PMC - PubMed

MeSH terms

LinkOut - more resources