. 2018 Feb 15;19(1):147.
doi: 10.1186/s12864-018-4497-0.

RNA secondary structure profiling in zebrafish reveals unique regulatory features

Affiliations

RNA secondary structure profiling in zebrafish reveals unique regulatory features

Kriti Kaushik et al. BMC Genomics. .

Abstract

Background: RNA is known to play diverse roles in gene regulation. The clues for this regulatory function of RNA are embedded in its ability to fold into intricate secondary and tertiary structure.

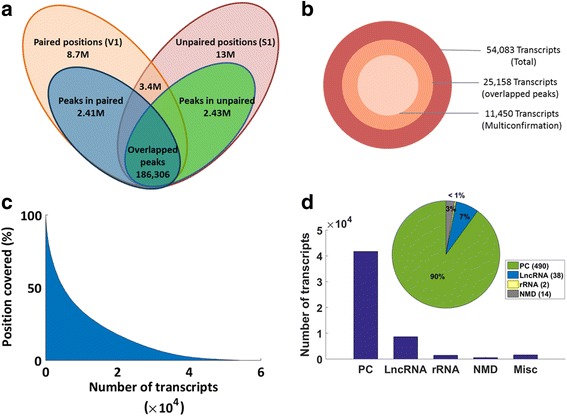
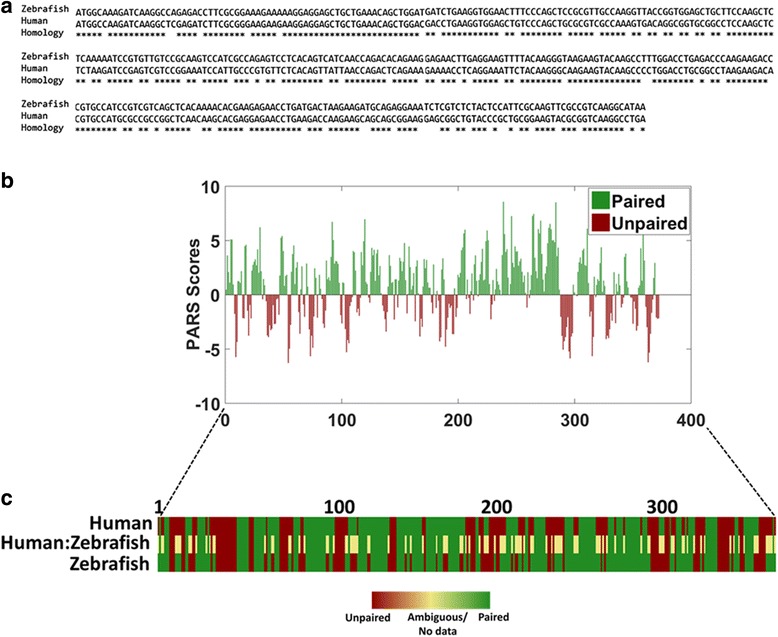
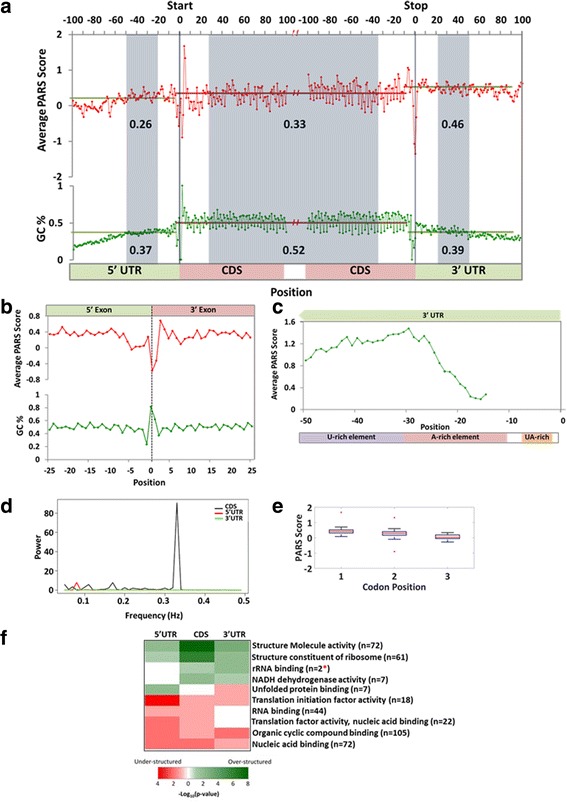
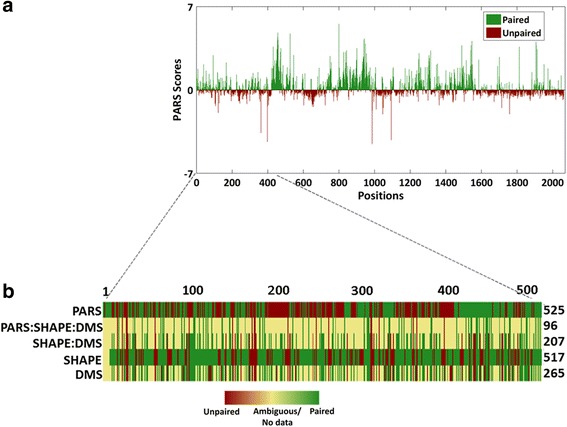
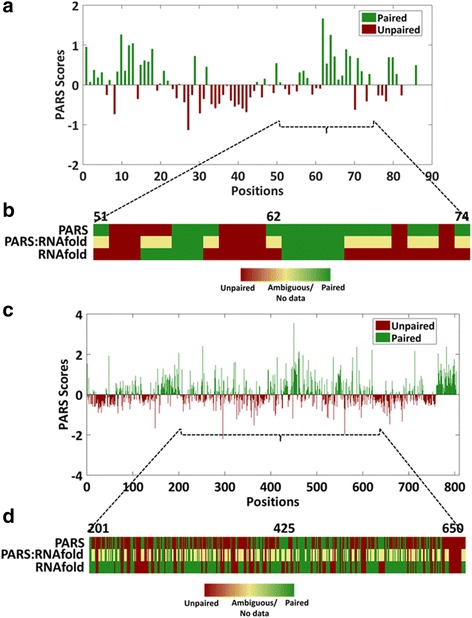
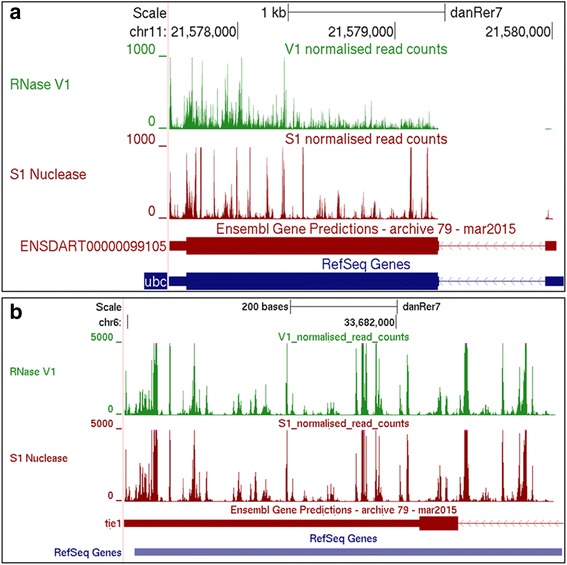
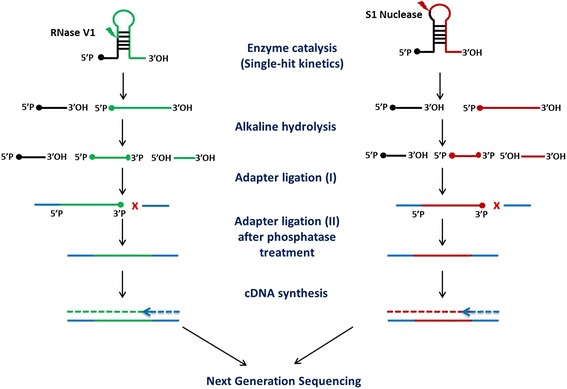
Results: We report the transcriptome-wide RNA secondary structure in zebrafish at single nucleotide resolution using Parallel Analysis of RNA Structure (PARS). This study provides the secondary structure map of zebrafish coding and non-coding RNAs. The single nucleotide pairing probabilities of 54,083 distinct transcripts in the zebrafish genome were documented. We identified RNA secondary structural features embedded in functional units of zebrafish mRNAs. Translation start and stop sites were demarcated by weak structural signals. The coding regions were characterized by the three-nucleotide periodicity of secondary structure and display a codon base specific structural constrain. The splice sites of transcripts were also delineated by distinct signature signals. Relatively higher structural signals were observed at 3' Untranslated Regions (UTRs) compared to Coding DNA Sequence (CDS) and 5' UTRs. The 3' ends of transcripts were also marked by unique structure signals. Secondary structural signals in long non-coding RNAs were also explored to better understand their molecular function.

Conclusions: Our study presents the first PARS-enabled transcriptome-wide secondary structure map of zebrafish, which documents pairing probability of RNA at single nucleotide precision. Our findings open avenues for exploring structural features in zebrafish RNAs and their influence on gene expression.

Keywords: Gene regulation; PARS; RNA secondary structure; Transcriptome; Zebrafish.


Conflict of interest statement

Ethics approval and consent to participate

Fish experiments were performed in strict accordance with the recommendations and guidelines laid down by the CSIR Institute of Genomics and Integrative Biology, India. The protocol was approved by the Institutional Animal Ethics Committee (IAEC) of the CSIR Institute of Genomics and Integrative Biology, India. All efforts were made to minimize animal suffering.

Consent for publication

Not applicable.

Competing interests

The authors declare that they have no competing interests.

Publisher’s Note

Springer Nature remains neutral with regard to jurisdictional claims in published maps and institutional affiliations.

Figures

Fig. 1
Fig. 1
Overview of the transcriptome generated by PARS. a. Venn diagram representing paired and unpaired positions at 24 hpf zebrafish transcriptome obtained from PARS data. Approximately, 3.4 million positions are jointly obtained in both V1 and S1 cleaved samples. Blue (V1) and the green (S1) ellipse display positions with ratio score > 1, termed as peaks. Of these, 186,306 positions are overlapped peaks showing ambiguous positions. b. A total of 54,083 transcripts were assembled, from which 25,158 transcripts have positions with overlapping peaks in both V1 and S1 dataset. Amongst these 11,450 transcripts had more than 5 positions overlapping and are categorised as multi-conformation transcripts. c. Abundance of transcripts based on per base structure coverage. Coverage of the total transcripts (54,083) was estimated by the number of reads relative to the positions covered and the length of the transcript. Most of the transcripts (46,173) were less than 40% covered, 7366 transcripts were 40–85% covered, while 544 transcripts were > 85% covered. d. Bar plot representing the biotype of 54,083 transcripts. The biotype of the transcripts is represented. The inset pie shows distribution of transcripts with > 85% covered based on the function. PC: protein coding, lncRNA: long non-coding RNA, NMD: non-sense mediated decay, rRNA: ribosomal RNA, Misc: miscellaneous
Fig. 2
Fig. 2
RNA secondary structure of rpl35 in zebrafish and human. a. Sequence conservation within CDS of rpl35 across human and zebrafish. Rpl35 homologs in zebrafish and humans show 81% sequence homology. b. Bar graph representing PARS scores from CDS of rpl35 in zebrafish. Red bars with negative PARS scores are unpaired, while positive scores in green are paired positions. c. Heatmap showing comparison of the paired and unpaired positions in rpl35 of zebrafish and human. PARS based secondary structure signals reveal 71% structure homology. Red represents unpaired, green represents paired positions while yellow represents no consensus between the two homolog structures
Fig. 3
Fig. 3
Comparison of RNA structures of ubc 3’UTR as determined by PARS based pairing probability and enzymatic footprinting using RNase V1 and S1 Nuclease. a. Bar plot represents PARS scores of 3’UTR region of ubiquitin c (ubc). Out of 105 positions, 87 positions are captured by PARS. b. Enzymatic footprinting of ubc 3’UTR probed by S1 Nuclease and RNase V1. Nucleotide positions are correlated with alkaline hydrolysis (AH) ladder and RNase T1 (G) ladder. Positions with similar structural pattern with PARS scores are highlighted. Red dots indicate unpaired positions; green indicates paired positions while yellow represents ambiguous regions. c. Heatmap representing secondary structure of 68 positions of ubc 3’UTR as determined by PARS and enzymatic footprinting (FP). Top panel represents PARS pairing probability; bottom panel indicates enzymatic footprinting pairing probability; middle panel represents the consensus between the two (PARS: FP). Red represents unpaired, green represents paired and yellow represents ambiguous regions
Fig. 4
Fig. 4
PARS reveals distinct RNA secondary structural signatures in functional units of transcripts. a. PARS scores across the 5’UTR, the coding region (CDS), and the 3’UTR of Zebrafish mRNAs are represented. PARS scores averaged across 451 transcripts with load > 1 and position coverage > 85%, aligned by the translational start and stop sites are represented. Averaged PARS scores and GC% are reported for regions are shaded in grey. b. Line graph representing average PARS scores and GC% across 25 nucleotides flanking the splice junctions of 451 transcripts are represented. c. Line graph displaying average PARS scores for last 50 nucleotides of the 3’ UTRs (n = 451) are represented. d. Line graph representing amplitude vs frequency of the Discrete Fourier Transform analysis of the average PARS scores of CDS, 3’ UTR and 5’ UTR corresponds to 451 transcripts. The highest frequency peak is obtained at 0.33 in CDS, showing a periodicity of 3 bases. e. Boxplot for average PARS scores for every codon position for first 100 CDS positions in 451 transcripts. The pairing probability of every position in a codon follows 1 > 2 > 3 (p value = 1.9e-07). Every position significantly differs from the other position by a p value = 1.702e-08 (ANOVA). f. Region-wise pattern of RNA secondary structures within enriched molecular function GO categories. The heatmap represents the region-wise (5’UTR, CDS and 3’UTR) significant p-values obtained from Wilcoxon rank sum test performed using the average PARS scores calculated for transcripts belonging to each enriched GO category. Red color suggests that genes belonging to the specific GO category shows under-structuring or lower PARS scores than the expected average PARS score for the region, where as shades of green depict over-structuring of genes belonging to the specific GO category in the respective regions. The asterisk * indicates that no significant conclusion can be drawn for a small number of genes (n = 2) in rRNA binding category
Fig. 5
Fig. 5
Secondary structure of human non-coding RNA, HOTAIR. a. Bar graph representing PARS scores of 2062 positions of HOTAIR. Red bars with negative PARS scores are unpaired, while positive scores in green are paired positions. b. Heatmap with comparison of the paired and unpaired positions in domain 1 (1 to 525 positions) of HOTAIR. PARS scores are compared with structure data obtained from SHAPE and DMS probing. Red represents unpaired, green represents paired positions while yellow represents no data for that position. Upon comparison, 207 out of 518 positions were correlated by SHAPE and DMS, while PARS has consensus of 96 positions amongst these 207 positions
Fig. 6
Fig. 6
Secondary structure of zebrafish non-coding RNA as determined by PARS. a. Bar plot representing PARS scores of y-rna for 83 positions out of 106 positions. b. Heatmap with comparisons of pairing probability of the binding region of y-rna as determined by PARS and computational predictions by RNAfold. c. Bar plot representing PARS scores of tie1-as for 803 positions out of 819 positions. d. Heatmap with comparison of pairing probability of tie1-as as determined by PARS and RNAfold
Fig. 7
Fig. 7
UCSC snapshot of single nucleotide resolved RNA secondary structure map for (a) ubiquitin c and (b) tie1-as
Fig. 8
Fig. 8
Schematic of RNA structure probing by PARS in zebrafish. Poly-A RNA from zebrafish is folded in-vitro. The folded RNA is cleaved by RNase V1 and S1 nuclease separately. The enzyme cut sites generate 5’P ends and 3’ OH ends at the cleaved sites. Long fragments generated by single-hit kinetics are further fragmented by alkaline hydrolysis, which blocks the 3′ site of the enzyme-cut fragments. Sequencing adapters are ligated to the 5′ end followed by alkaline phosphatase treatment to 3’ P group. Adapters are ligated to 3’ends followed cDNA synthesis and PCR purification of the library. Appropriate size of the library is maintained by purification by nucleic acid beads. Sequenced reads are aligned back to the genome and only unique reads with the correct read start positions are considered for PARS score calculation

References

    1. Zenkin N. RNA secondary structure-dependent termination of transcription. Cell Cycle. 2014;13(1):3–4. doi: 10.4161/cc.27018. - DOI - PMC - PubMed
    1. Dethoff EA, Chugh J, Mustoe AM, Al-Hashimi HM. Functional complexity and regulation through RNA dynamics. Nature. 2012;482(7385):322–330. doi: 10.1038/nature10885. - DOI - PMC - PubMed
    1. Jacobs E, Mills JD, Janitz M. The role of RNA structure in posttranscriptional regulation of gene expression. J Genet Genomics. 2012;39(10):535–543. doi: 10.1016/j.jgg.2012.08.002. - DOI - PubMed
    1. Yang Y, Zhan L, Zhang W, Sun F, Wang W, Tian N, Bi J, Wang H, Shi D, Jiang Y, et al. RNA secondary structure in mutually exclusive splicing. Nat Struct Mol Biol. 2011;18(2):159–168. doi: 10.1038/nsmb.1959. - DOI - PubMed
    1. Brion P, Westhof E. Hierarchy and dynamics of RNA folding. Annu Rev Biophys Biomol Struct. 1997;26:113–137. doi: 10.1146/annurev.biophys.26.1.113. - DOI - PubMed

Publication types

LinkOut - more resources