

Temporo-spatial dynamics and behavioural patterns of 2012 cholera epidemic in the African mega-city of Conakry, Guinea
- PMID: 29448965
- PMCID: PMC5815196
- DOI: 10.1186/s40249-018-0393-8
Temporo-spatial dynamics and behavioural patterns of 2012 cholera epidemic in the African mega-city of Conakry, Guinea
Abstract
Background: Cholera is endemic in Guinea, having suffered consecutive outbreaks from 2004 to 2008 followed by a lull until the 2012 epidemic. Here we describe the temporal-spatial and behavioural characteristics of cholera cases in Conakry during a three-year period, including the large-scale 2012 epidemic.
Methods: We used the national and African Cholera Surveillance Network (Africhol) surveillance data collected from every cholera treatment centre in Conakry city from August 2011 to December 2013. The prevalence of suspect and confirmed cholera cases, the case fatality ratio (CFR), and the factors associated with suspected cholera were described according to three periods: pre-epidemic (A), epidemic 2012 (B) and post epidemic (C). Weekly attack rates and temporal-spatial clustering were calculated at municipality level for period B. Cholera was confirmed by culture at the cholera national reference laboratory.
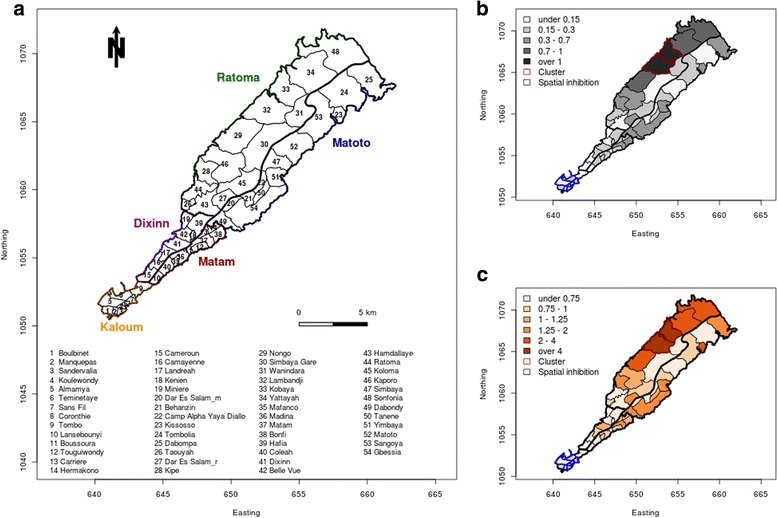
Results: A total of 4559 suspect cases were reported: 66, 4437, and 66 suspect cases in periods A, B and C, respectively. Among the 204 suspect cases with culture results available, 6%, 60%, and 70% were confirmed in periods A, B, and C, respectively. With 0.3%, the CFR was significantly lower in period B than in periods A (7.6%) and C (7.1%). The overall attack rate was 0.28% in period B, ranging from 0.17% to 0.31% across municipalities. Concomitantly, a cluster of cases was identified in two districts in the northern part of Conakry. At 14%, rice water stools were less frequent in period A than in period B and C (78% and 84%). Dehydration (31% vs 94% and 89%) and coma (0.4% vs 3.1% and 2.9%) were lower during period B than in periods A and C. The treatment of drinking water was less frequent in period A, while there were more reports of recent travel in period C.
Conclusions: The epidemic dynamic and the sociological description of suspect cases before, during, and after the large-scale epidemic revealed that the Vibrio cholerae was already present before the epidemic. However, it appeared that infected individuals reacted differently in terms of disease severity as well as their access to treated water and travel habits. Such an in-depth description of cholera epidemics should be systematically carried out in cholera endemic settings in order to prioritize higher risk areas, identify transmission factors, and optimize preventive interventions.
Keywords: Cholera; Guinea; Space-time clustering.
Conflict of interest statement
Ethics approval and consent to participate
No ethics approval or consent was necessary as the data were gathered through the surveillance system, which was strengthened during the 2012 cholera outbreak.
Africhol provided technical and financial resources to national MoHs to support cholera surveillance in participating countries. In these countries, including Guinea, cholera is part of national integrated disease surveillance and response supported by the World Health Organisation (WHO). The Africhol protocol was approved and implemented by the MoH and covered by national public health laws.
Consent for publication
No consent for publication was sought since the data were gathered through the surveillance system, which was strengthened during the 2012 cholera outbreak.
Competing interests
The authors declare that they have no competing interests.
Figures

References
-
- WHO. 2004;79(31):281–288. [cited 2014 Sep 13]. Available from: http://www.who.int/wer/2004/wer7931/en/.
-
- WHO. 2005;80(31):261–268. [cited 2014 Sep 13]. Available from: http://www.who.int/wer/2005/wer8031/en/.
-
- WHO. 2006;81(31):297–308. [cited 2014 Sep 13]. Available from: http://www.who.int/wer/2006/wer8131/en/.
MeSH terms
Grants and funding
LinkOut - more resources
Full Text Sources
Other Literature Sources
Medical
