

Fatty acid synthase mediates EGFR palmitoylation in EGFR mutated non-small cell lung cancer
- PMID: 29449326
- PMCID: PMC5840543
- DOI: 10.15252/emmm.201708313
Fatty acid synthase mediates EGFR palmitoylation in EGFR mutated non-small cell lung cancer
Abstract
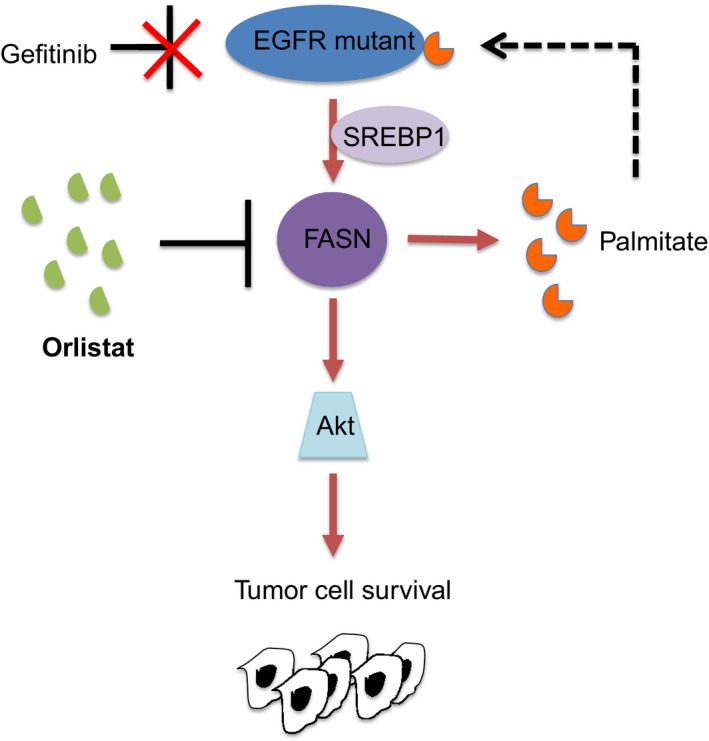
Metabolic reprogramming is widely known as a hallmark of cancer cells to allow adaptation of cells to sustain survival signals. In this report, we describe a novel oncogenic signaling pathway exclusively acting in mutated epidermal growth factor receptor (EGFR) non-small cell lung cancer (NSCLC) with acquired tyrosine kinase inhibitor (TKI) resistance. Mutated EGFR mediates TKI resistance through regulation of the fatty acid synthase (FASN), which produces 16-C saturated fatty acid palmitate. Our work shows that the persistent signaling by mutated EGFR in TKI-resistant tumor cells relies on EGFR palmitoylation and can be targeted by Orlistat, an FDA-approved anti-obesity drug. Inhibition of FASN with Orlistat induces EGFR ubiquitination and abrogates EGFR mutant signaling, and reduces tumor growths both in culture systems and in vivo Together, our data provide compelling evidence on the functional interrelationship between mutated EGFR and FASN and that the fatty acid metabolism pathway is a candidate target for acquired TKI-resistant EGFR mutant NSCLC patients.
Keywords: FASN; NSCLC; EGFR‐TKI; acquired resistance; palmitoylation.
© 2018 The Authors. Published under the terms of the CC BY 4.0 license.
Figures
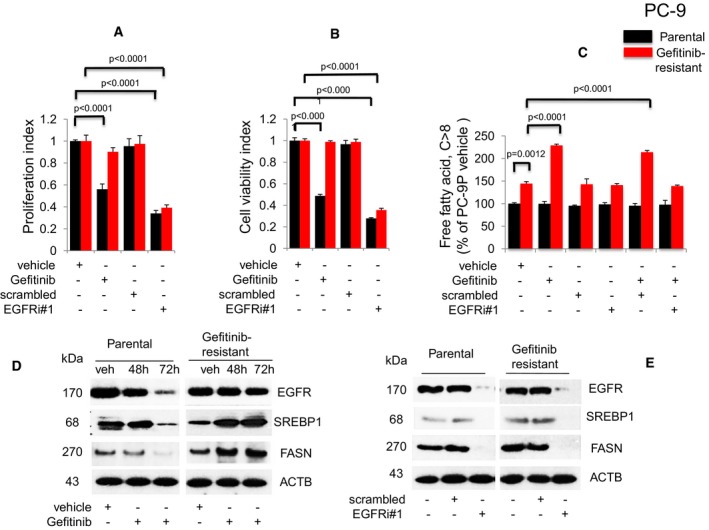
- A,B
Proliferation (n = 3, A) and viability (n = 3, B) assays on cells exposed to Gefitinib or EGFR siRNAs for 72 h. Significance in differences in proliferation and viability indexes, in which vehicle acted as control, was determined by t‐test. Error bars denote SEM.
- C
Measurement of cellular free fatty acid (FFA, n = 3) after Gefitinib treatment or EGFR knockdown for 72 h. Significance in differences in cellular FFA, normalized against PC‐9P vehicle, was determined by t‐test. Error bars denote SEM.
- D
Western blot analysis of cells treated with either vehicle (72 h) or Gefitinib (48 and 72 h).
- E
Western blot analysis of cells exposed to either scrambled or EGFR siRNAs (EGFRi#1) for 72 h. ACTB was assessed as housekeeping gene. Vehicle cells acted as controls.
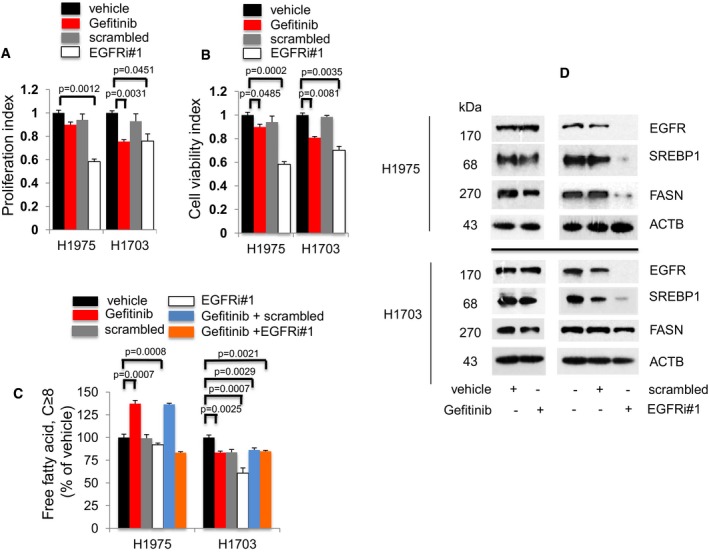
- A, B
Proliferation (n = 3, A) and cell viability (n = 3, B) assays to determine the effects of Gefitinib or EGFR knockdown exposure on EGFR T790M/L858R H1975 and EGFR wild‐type H1703 cells after 72 h. Significance in differences in proliferation and viability indexes, in which vehicle acted as control, was determined by t‐test. Error bars denote SEM.
- C
Measurement of cellular free fatty acid (FFA, n = 3) after Gefitinib or EGFR knockdown for 72 h. Significance in differences in cellular FFA, in which vehicle acted as control, was determined by t‐test. Error bars denote SEM.
- D
Western blot analysis of H1975 and H1703 cells. Cells were treated with vehicle or Gefitinib for 72 h (left panel). Cells were exposed to either scrambled siRNA or EGFR siRNAs for 72 h (right panel). Vehicle or scrambled‐treated cells acted as controls. ACTB was selected as a housekeeping gene control.
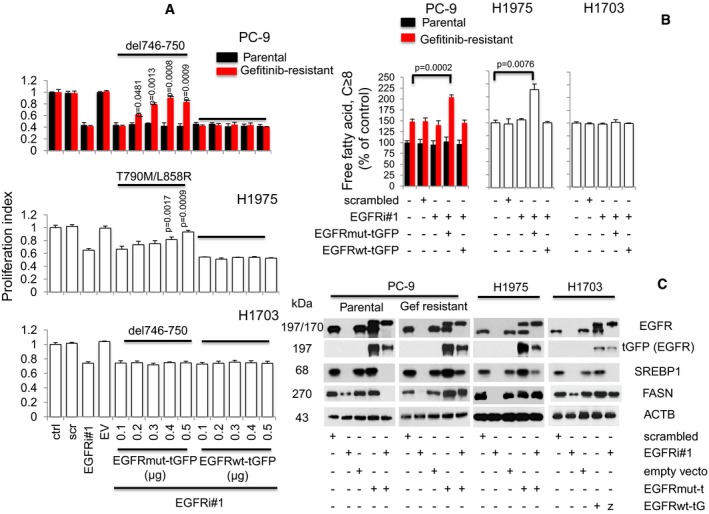
Proliferation assays (n = 3) of tGFP‐tagged EGFR (wild type, ΔE746‐A750, or L858R/T790M) overexpression in EGFR silenced cells. Cells were allowed to attach overnight in 96‐well format prior to transfection with EGFR siRNAs (EGFRi#1, 25 nM) for 12 h. This was followed by transfection with tGFP‐tagged EGFR constructs ranging from 0.1 to 0.5 μg in increments of 0.1 μg for additional 60 h (total 72 h). Significance in differences in proliferation index, in which EGFRi#1 cells acted as controls, was determined by t‐test. Error bars denote SEM.
Cells were treated with either scrambled, EGFRi#1, EGFRi#1, and tGFP‐tagged EGFR mutant combination, or EGFRi#1 and tGFP‐tagged EGFR wild‐type combinations for 72 h. Cellular free fatty acid (n = 3) was then measured, and significance was determined by t‐test with untreated cells as control. Error bars denote SEM.
Western blot data showing EGFR, exogenous tGFP‐tagged EGFR, SREBP1, and FASN expression in NSCLC cells, respectively. Cells were grown in 100‐mm dishes overnight prior to EGFR siRNAs (EGFRi#1) transfection for 12 h. This was followed by transfection of 6 μg of respective tGFP‐tagged EGFR constructs with further incubation of 60 h (total 72 h). ACTB was selected as housekeeping gene.
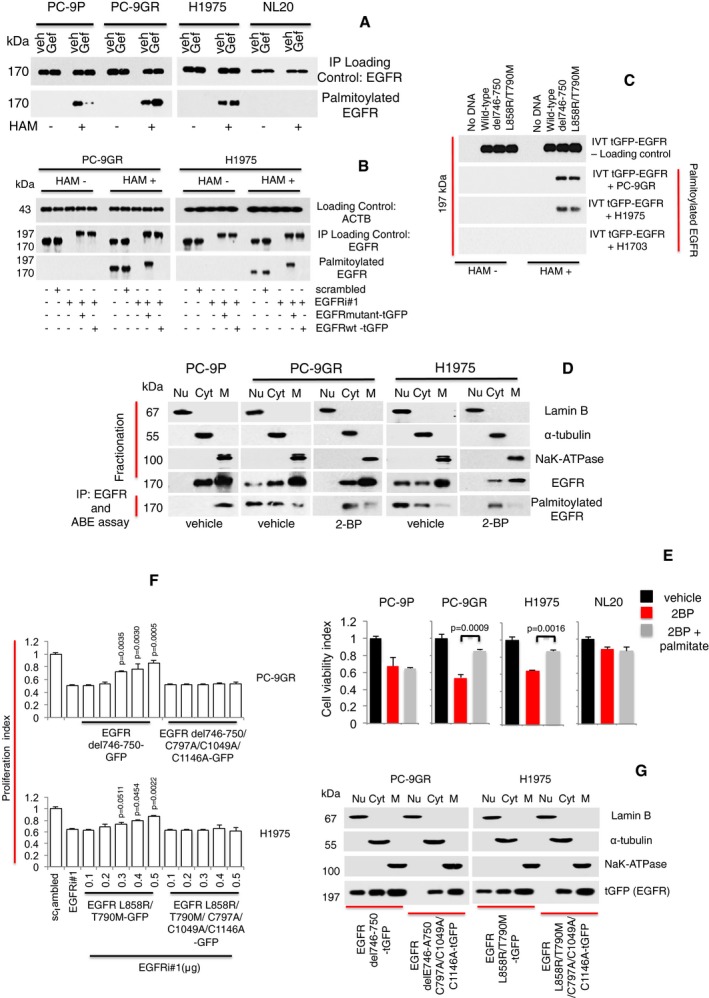
Western blot analysis showing EGFR palmitoylation levels in PC‐9P, PC‐9GR, H1975, and NL20 cells treated with Gefitinib for 72 h. Hydroxylamine (HAM) is a strong reducing agent that cleaves palmitate from cysteine residues and is necessary for biotinylation. The omission of HAM cleavage (HAM‐) serves as negative control for ABE assay.
Western blot data showing EGFR palmitoylation in cells treated with either scrambled, EGFRi#1, EGFRi#1 plus tGFP‐tagged EGFR mutant combination, or EGFRi#1 plus tGFP‐tagged EGFR wild‐type for 72 h. tGFP‐tagged EGFR is about 197 kDa, while EGFR is 170 kDa.
Western blot analysis showing palmitoylation of mutated EGFR under cell‐free conditions. Cell‐free synthesized tGFP‐tagged EGFR was generated by in vitro translation using vectors containing EGFR wild‐type or mutants (del746‐750 or L858R/T790M), with no DNA/template as negative control. Fresh extracts of PC‐9GR, H1975 and H1703 cells were prepared in hypotonic buffer. For in vitro palmitoylation, synthesized tGFP‐tagged EGFR was incubated in cell extracts for 1 h at 37°C, followed by ABE assay and Western blotting.
Vehicle‐ and 2‐bromopalmitic acid (50 μM of 2‐BP)‐treated cells were harvested and cellular fractionation was carried out to obtain nuclear, cytosolic, and membrane fractions and a part of these fractions were analyzed by Western blotting to detect EGFR. The remaining fractions were subjected to EGFR pulldown by anti‐EGFR antibody and in vitro ABE assay. Palmitoylation of EGFR was then determined by Western blot analysis.
Cell viability assays (n = 3) of cells were first treated with 250 μM of 2‐BP for 24 h, followed by the supplementation of 10 μM of palmitate and a further incubation for 48 h. Significance in differences in viability index, in which 2‐BP‐treated cells acted as controls, was determined by t‐test. Error bars denote SEM.
Growth curves (n = 3) illustrating the proliferation index of cells treated with scrambled, EGFR siRNAs (EGFRi#1) alone or in combination with transfection of tGFP‐tagged EGFR mutant (del746‐750 or L858R/T790M) constructs with or without C797A/C1049A/C1146A mutations for 72 h. Significance in differences in proliferation index, in which EGFRi#1 cells acted as controls, was determined by t‐test. Error bars denote SEM.
Cells were transfected with tGFP‐tagged EGFR mutant (del746‐750 or L858R/T790M) constructs with or without C797A/C1049A/C1146A mutations and harvested after 72 h. Cellular fractionation was performed to separate nuclear, cytosolic, and membrane fractions. Fractionates were then analyzed by Western blot analysis to detect the distribution of tGFP‐tagged EGFR with anti‐tGFP antibody.
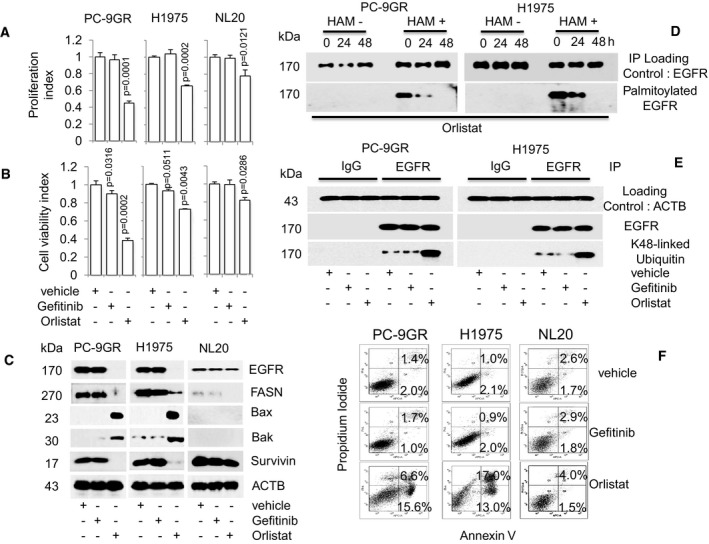
- A, B
Cell proliferation (n = 3, A) and viability (n = 3, B) assays on the effect of Orlistat (100 μM) on cells at indicated doses for 72 h (upper and lower panels respectively). Significance in differences in proliferation and viability indexes, in which vehicle acted as control, was determined by t‐test. Error bars denote SEM.
- C
Western blot analysis of EGFR, FASN, Bax, Bak, and survivin protein expression from cells exposed to either Gefitinib or Orlistat for 48 h. ACTB is selected as a housekeeping gene. Vehicle‐treated cells acted as controls.
- D
Western blot data showing EGFR palmitoylation in Orlistat‐treated cells (48 h). Hydroxylamine (HAM), a strong reducing agent that cleaves palmitate from cysteine residues, is necessary for biotinylation. The omission of HAM cleavage (HAM‐) serves as negative control for the ABE assay.
- E
Western blot images showing ubiquitination status of EGFR in cells after exposure to vehicle, Gefitinib or Orlistat for 48 h.
- F
FACS analysis (n = 2) for Annexin V/PI staining shows percentages of early (Annexin+) and late (Annexin and PI+) apoptotic cells treated with vehicle, Gefitinib or Orlistat for 48 h.
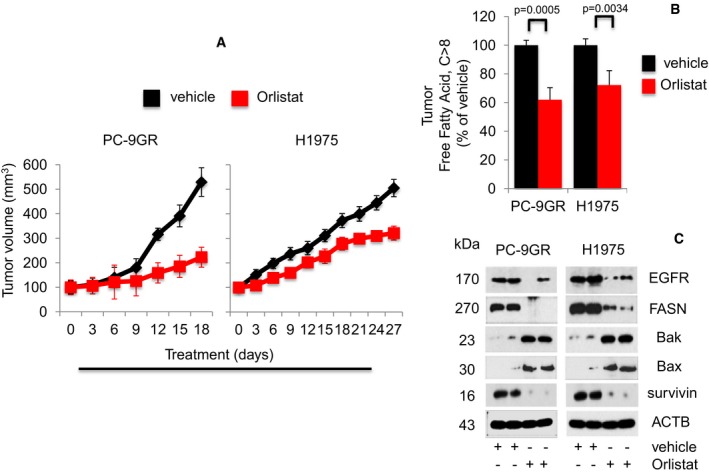
Growth curve of xenografts from NSG mice treated with either vehicle (n = 5) or Orlistat (n = 5) at 240 mg/kg body weight (upper panels). Representative images of xenografts from vehicle‐ and Orlistat‐treated mice (lower panels). Significance in differences in tumor sizes, in which vehicle acted as control, was determined by t‐test. Error bars denote SEM.
Measurement of FFAs from tumors derived from vehicle‐ or Orlistat‐treated xenograft mice (n = 5 each group). Significance in differences in FFAs, in which vehicle acted as control, was determined by t‐test. Error bars denote SEM.
Western blot analysis of EGFR, FASN, Bax, Bak, and survivin expression in protein extracts from representative xenograft tumors treated with vehicle‐ and Orlistat‐treated groups.
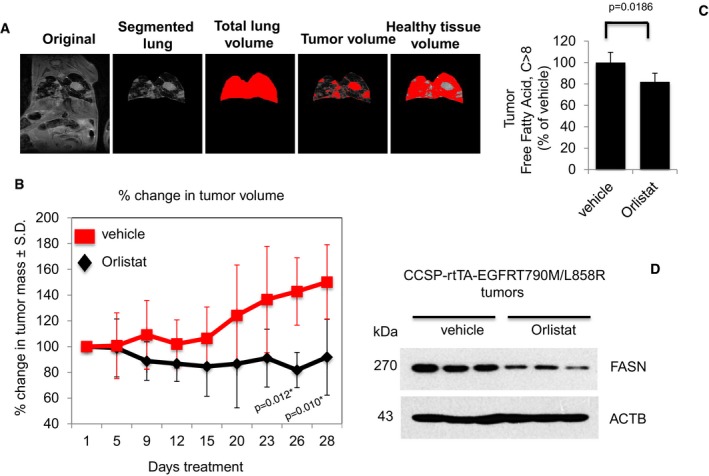
Representative image depicting the determination of tumor burden through manual segmentation. Tumor burden is measured by first defining the lung area, and subsequently determining the average MRI lung image intensity for tumor volume in relation to normal lung volume.
Graph shows percentage of change in tumor volume between Orlistat‐ (n = 7) and vehicle‐treated (n = 6) groups. Significance in differences in tumor volumes, in which vehicle acted as control, was determined by t‐test. Error bars denote SEM.
Measurement of FFAs from tumors of vehicle‐ or Orlistat‐treated transgenic mice (n = 5 for vehicle and n = 6 for Orlistat groups). Significance in differences in tumor FFAs levels, in which vehicle acted as control, was determined by t‐test. Error bars denote SEM.
Western blot showing FASN expression in protein extracts from representative tumors from vehicle‐ and Orlistat‐treated groups.
References
-
- Agostini M, Almeida LY, Bastos DC, Ortega RM, Moreira FS, Sequin F, Zecchin KG, Raposo HF, Oliveira HC, Amoedo ND et al (2014) The fatty acid synthase inhibitor orlistat reduces the growth and metastasis of orthotopic tongue oral squamous cell carcinomas. Mol Cancer Ther 13: 585–595 - PubMed
-
- Aicart‐Ramos C, Valero RA, Rodriguez‐Crespo I (2011) Protein palmitoylation and subcellular trafficking. Biochim Biophys Acta 1808: 2981–2994 - PubMed
-
- Alo’ PL, Visca P, Marci A, Mangoni A, Botti C, Di Tondo U (1996) Expression of fatty acid synthase (FAS) as a predictor of recurrence in stage I breast carcinoma patients. Cancer 77: 474–482 - PubMed
-
- Blaskovic S, Blanc M, van der Goot FG (2013) What does S‐palmitoylation do to membrane proteins? FEBS J 280: 2766–2774 - PubMed
Publication types
MeSH terms
Substances
Grants and funding
LinkOut - more resources
Full Text Sources
Other Literature Sources
Medical
Molecular Biology Databases
Research Materials
Miscellaneous
