Comparative Study
. 2018 Mar;29(3):806-824.
doi: 10.1681/ASN.2017080890. Epub 2018 Feb 15.

Conserved and Divergent Features of Mesenchymal Progenitor Cell Types within the Cortical Nephrogenic Niche of the Human and Mouse Kidney

Affiliations
Comparative Study

Conserved and Divergent Features of Mesenchymal Progenitor Cell Types within the Cortical Nephrogenic Niche of the Human and Mouse Kidney

Nils O Lindström et al. J Am Soc Nephrol. 2018 Mar.

Abstract

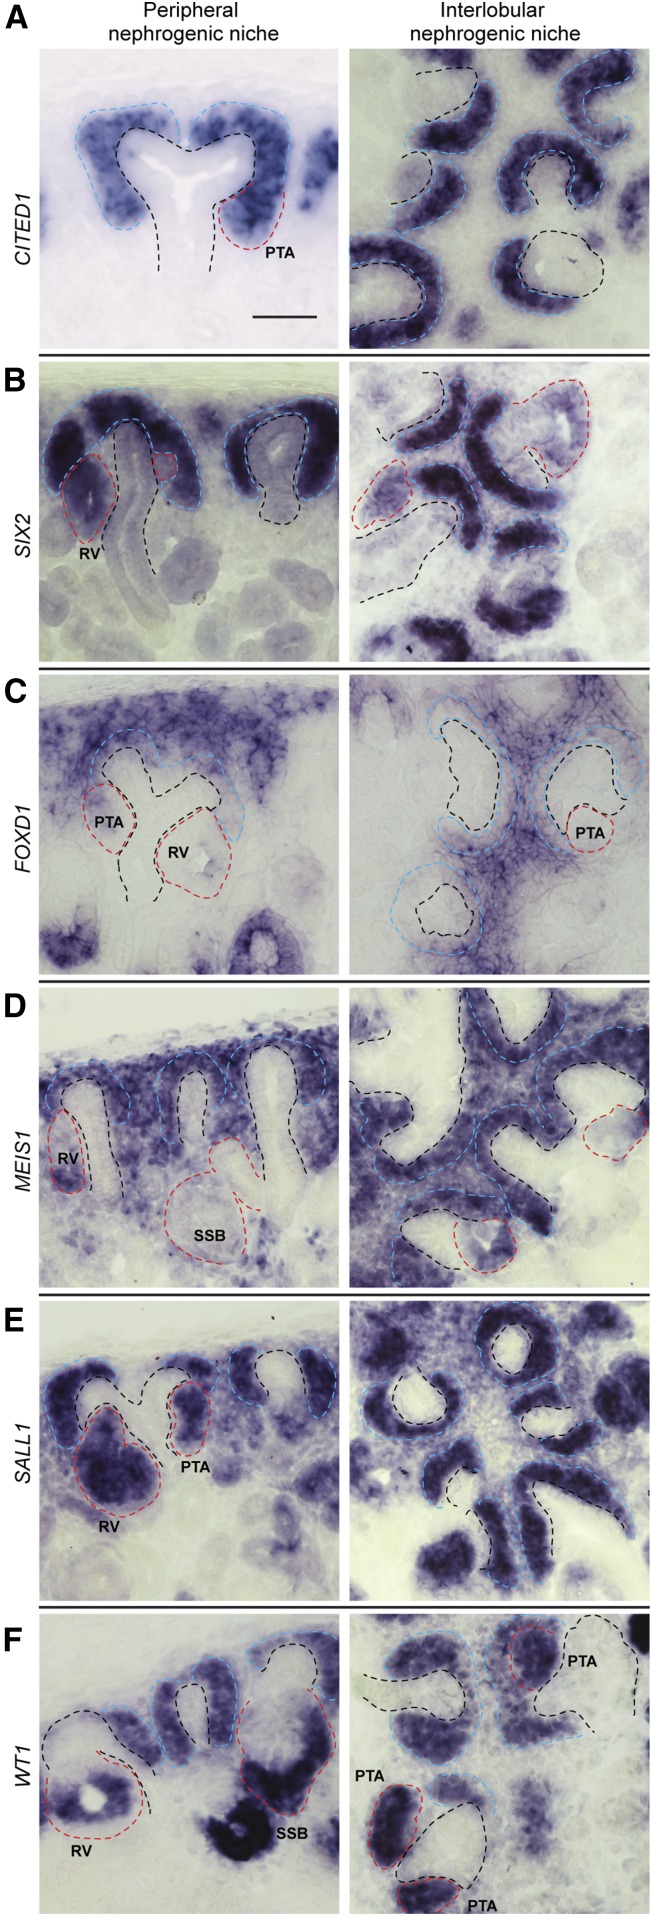
Cellular interactions among nephron, interstitial, and collecting duct progenitors drive mammalian kidney development. In mice, Six2+ nephron progenitor cells (NPCs) and Foxd1+ interstitial progenitor cells (IPCs) form largely distinct lineage compartments at the onset of metanephric kidney development. Here, we used the method for analyzing RNA following intracellular sorting (MARIS) approach, single-cell transcriptional profiling, in situ hybridization, and immunolabeling to characterize the presumptive NPC and IPC compartments of the developing human kidney. As in mice, each progenitor population adopts a stereotypical arrangement in the human nephron-forming niche: NPCs capped outgrowing ureteric branch tips, whereas IPCs were sandwiched between the NPCs and the renal capsule. Unlike mouse NPCs, human NPCs displayed a transcriptional profile that overlapped substantially with the IPC transcriptional profile, and key IPC determinants, including FOXD1, were readily detected within SIX2+ NPCs. Comparative gene expression profiling in human and mouse Six2/SIX2+ NPCs showed broad agreement between the species but also identified species-biased expression of some genes. Notably, some human NPC-enriched genes, including DAPL1 and COL9A2, are linked to human renal disease. We further explored the cellular diversity of mesenchymal cell types in the human nephrogenic niche through single-cell transcriptional profiling. Data analysis stratified NPCs into two main subpopulations and identified a third group of differentiating cells. These findings were confirmed by section in situ hybridization with novel human NPC markers predicted through the single-cell studies. This study provides a benchmark for the mesenchymal progenitors in the human nephrogenic niche and highlights species-variability in kidney developmental programs.

Keywords: human genetics; kidney development; nephron.


Figures

None
Graphical abstract
Figure 1.
Figure 1.
In situ hybridization labeling for nephron compartment marker genes. (A-F) show expression for genes as indicated on fields. Left-hand and right column fields display in situ hybridization labeling of cryo-sectioned human week 14–15 kidneys. Sections show peripheral nephrogenic niches and interlobular nephrogenic niches (left and right, respectively). Red, blue, and black dashed lines indicate nascent nephrons, cap mesenchyme, and ureteric bud epithelium, respectively. PTA, pretubular aggregate; RV, renal vesicle; SSB, S-shaped body. Scale bar 50 μm.
Figure 2.
Figure 2.
Nephron and interstitial progenitor markers mix and persist into epithelializing nephrons. (A and D) Immunofluorescent stains for CITED1 and SIX2 in mouse and human kidneys. Insert in (D) shows CITED1 protein in the human RV (scale bar, 10 µm). (B, C, E, and F) Quantitative analyses of signal intensity distribution for CITED1 and SIX2. (G–L) Immunofluorescent analysis for FOXD1 and SIX2 and intensity correlation plots for these. White, blue, and red dashed lines indicate ureteric bud epithelium, cap mesenchyme, and nascent nephrons, respectively. Scale as indicated on fields. CM, cap mesenchyme; IM, interstitial mesenchyme; N, nephron; PTA, pretubular aggregate; RV, renal vesicle; UB, ureteric bud.
Figure 3.
Figure 3.
Transcriptional profiling of mouse and putative human NPCs assisted by intracellular staining of Six2/SIX2 followed by FACS (MARIS). (A) Separation of Six2+ cell population from dissociated mouse (m) embryonic kidney cortex cells by either FACS of Six2GFP reporter line (middle) or Six2 MARIS (right). (B) Gene-level correlation of normalized mRNA-Seq reads between NPC profiles generated by Six2 reporter line (Six2GFP+) and Six2 MARIS (mSIX2+). (C) Overlap (left) between NPC-specific genes identified by differential gene expression analysis between Six2GFP+ versus Six2GFP− (TPM_Six2GFP+>5, TPM_Six2GFP+/TPM_Six2GFP−>3, P<0.05), or between mSix2+ versus mSix2− (TPM_mSix2+>5, TPM_mSix2+/TPM_Six2−>3, P<0.05). Results (middle) of GO term enrichment analysis of the indicated gene sets, with representative ones (right) from each set of genes. (D) Separation of SIX2+ cell population from dissociated human (hu) fetal kidney cortex. (E) Gene-level correlation of normalized mRNA-seq reads between human and mouse NPC profiles obtained by MARIS; human (orange) or mouse (cyan) enriched genes were indicated. (F) Top three GO terms enriched from the human (top) and mouse (bottom) enriched genes. Ab, antibody; enrich., enriched; norm., normalized vs., versus.
Figure 4.
Figure 4.
In situ hybridization labeling for human and mouse enriched nephron progenitor genes. (A–O) In situ hybridization labeling of cryo-sectioned human week 16 kidneys. In situ labeling as indicated on fields. Inserts show enlarged regions from main fields. Scale bars as indicated on fields.
Figure 5.
Figure 5.
In situ hybridization labeling for human and mouse enriched nephron progenitor genes. (A–O) Complementary in situ hybridization labeling of cryo-sectioned mouse E15.5 and P2 mouse kidneys complementary to Figure 4. In situ labeling as indicated on fields. Scale bars as indicated on fields. Scale bars in magnified inserts are 20 µm.
Figure 6.
Figure 6.
Transcriptional profiling of human and mouse IPCs. (A) Gene-level correlation of normalized mRNA-seq reads between human (hu) IPC and NPC. (B) Gene-level correlation of normalized mRNA-seq reads between mouse (ms) IPC and NPC. (C) Immunostaining of interstitial markers in mouse and human kidneys as specified on fields. (D) Breakdown of mouse (top) or human (bottom) genes expressed in IPC or NPC by their relative expression in the two cell types. Genes enriched in one of the cell types satisfy TPM>5 and fold change >3. Other expressed genes are categorized as “non-DE.” (Middle) Pie chart shows breakdown of mouse IPC-enriched genes by their relative expression between human IPC and NPC. DE, differentially expressed enrich., enriched; norm., normalized; UB, ureteric bud epithelium; vs., versus.
Figure 7.
Figure 7.
Single-cell transcriptional profiling of human nephrogenic niche cells. (A) tSNE plot displaying principal component analysis of approximately 2800 human kidney cortex cells from week 16 kidney. Cell identities as indicated on figure by gene expression. Dashed line demarks the nephron progenitors. (B) Cluster hierarchies inferred from differential gene expression and GO-term analyses of top 50 differentially expressed genes per cluster. (C) tSNE plot displaying principal component analysis of cells from cluster 4 in (A). (D) Cluster hierarchies inferred from differential gene expression and GO-term analysis of top 50 differentially expressed genes per cluster as seen in (C). (E) tSNE plots displaying gene expression levels in cells. (F–J) Gene expression plots for novel and established NPC markers. Genes as indicated on plots. tSNE, t-Distributed Stochastic Neighbor Embedding.
Figure 8.
Figure 8.
Validation of NPC cell populations and exploration of novel NPC marker genes. (A) Genes identified in NPC subclusters stratify into distinct gene expression patterns; section in situ hybridization for genes as specified on fields, clusters as specified. (B) Gene expression plot for TMEM100, ROBO2, and CITED1. (C) Immunofluorescent staining for TMEM100, CITED1, ROBO2, and KRT8/19 in human fetal kidney. Scale bar as indicated. RV, renal vescile UB, ureteric bud epithelium

Comment in

  • The Era of Human Developmental Nephrology.
    Nishinakamura R. Nishinakamura R. J Am Soc Nephrol. 2018 Mar;29(3):705-706. doi: 10.1681/ASN.2017121280. Epub 2018 Feb 15. J Am Soc Nephrol. 2018. PMID: 29449450 Free PMC article. No abstract available.

References

    1. McMahon AP: Development of the mammalian kidney. In: Current Topics in Developmental Biology 117: pp 31–64, 2016 - PMC - PubMed
    1. Kobayashi A, Mugford JW, Krautzberger AM, Naiman N, Liao J, McMahon AP: Identification of a multipotent self-renewing stromal progenitor population during mammalian kidney organogenesis. Stem Cell Reports 3: 650–662, 2014 - PMC - PubMed
    1. Kobayashi A, Valerius MT, Mugford JW, Carroll TJ, Self M, Oliver G, McMahon AP: Six2 defines and regulates a multipotent self-renewing nephron progenitor population throughout mammalian kidney development. Cell Stem Cell 3: 169–181, 2008 - PMC - PubMed
    1. Barak H, Huh SH, Chen S, Jeanpierre C, Martinovic J, Parisot M, Bole-Feysot C, Nitschké P, Salomon R, Antignac C, Ornitz DM, Kopan R: FGF9 and FGF20 maintain the stemness of nephron progenitors in mice and man. Dev Cell 22: 1191–1207, 2012 - PMC - PubMed
    1. Brown AC, Muthukrishnan SD, Guay JA, Adams DC, Schafer DA, Fetting JL, Oxburgh L: Role for compartmentalization in nephron progenitor differentiation. Proc Natl Acad Sci U S A 110: 4640–4645, 2013 - PMC - PubMed

Publication types

MeSH terms